#4191ca

Identify Priority Issues for an Equitable Recovery with the New Racial Equity Index for Cities

The Racial Equity Index is our newest data tool for local action, designed to provide a single comparative metric for racial equity across the United States. Here, we share the rankings and key insights from the Racial Equity Index for the 100 largest cities in the United States in 2017. Visit the Racial Equity Index to explore all of the available data, including data for regions, states, and other points in time.


The 2017 Racial Equity Index rankings offer a unique snapshot of how US cities stack up on overall equity outcomes. Racial Equity Index values for the 100 largest cities ranged from 21 (Detroit, Michigan) to 76 (Irvine, California), indicating that no single place fared the best on every measure (which would have resulted in a score of 100), nor did any place perform the worst on all measures.

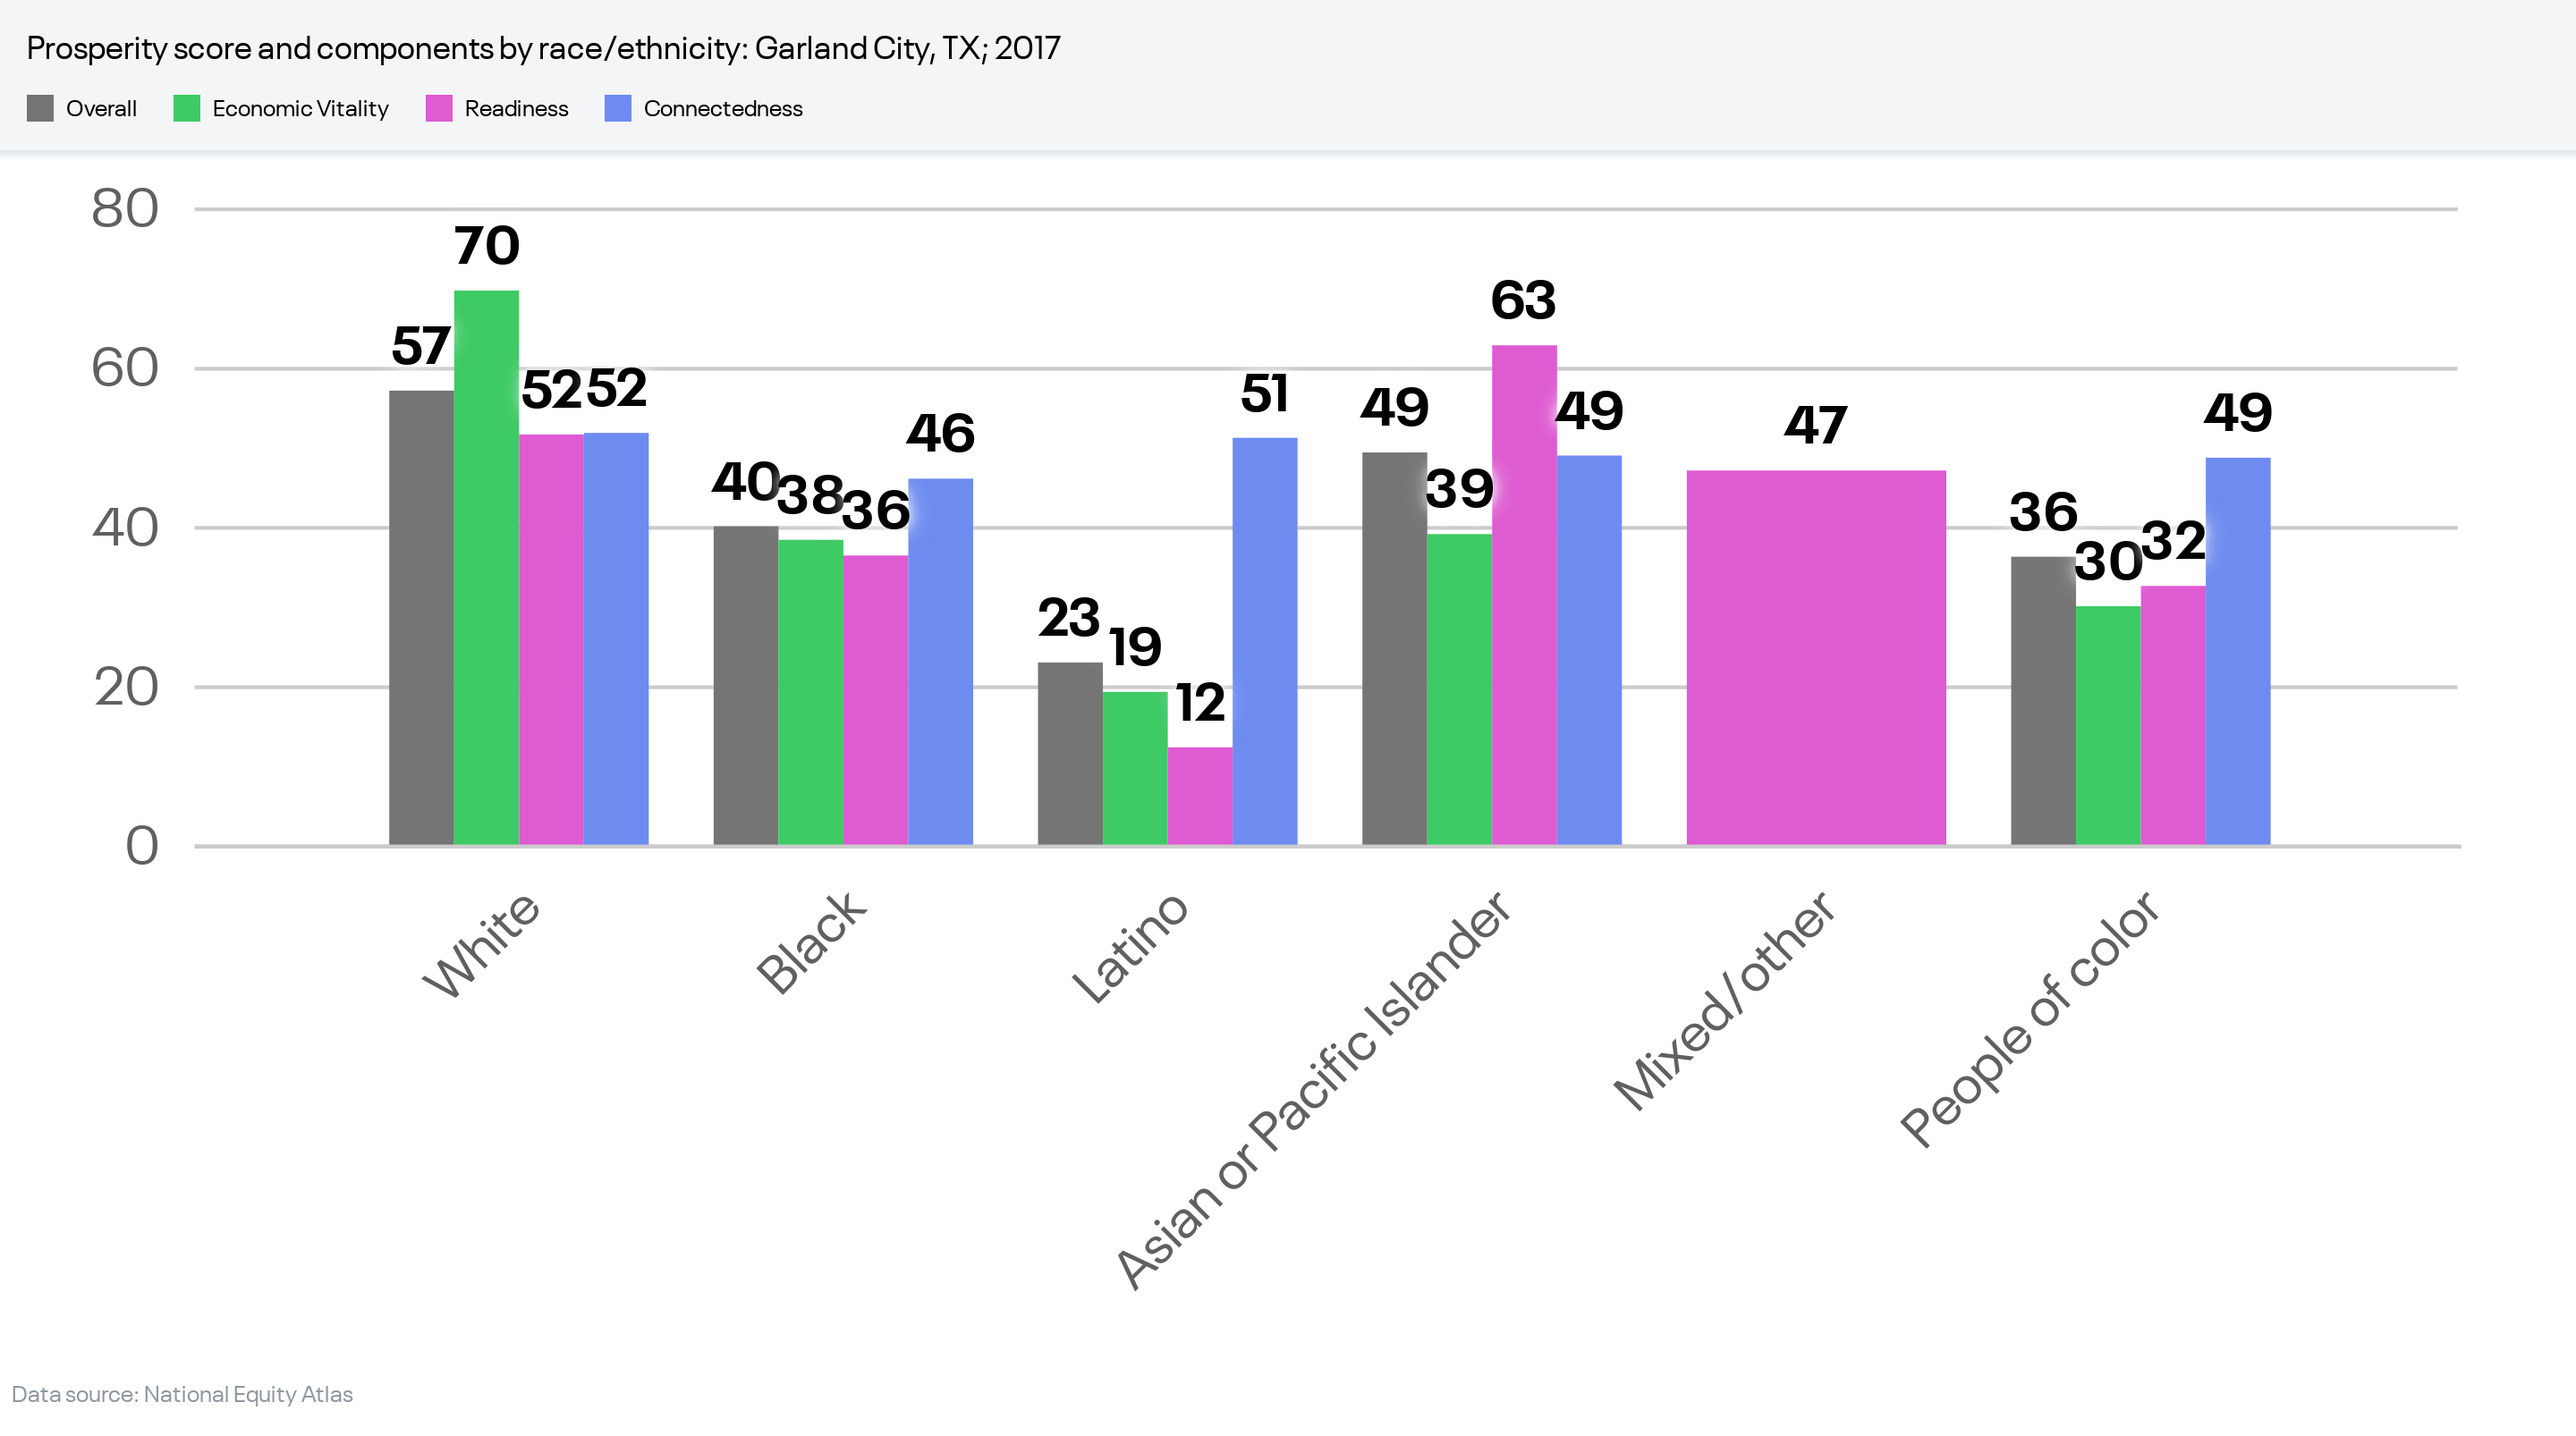
It is important to note that because all values are relative — meaning they measure how well a city is doing compared to other cities — even the top performer has room for improvement. For example, the city-level inclusion scores, which indicate the relative size of racial gaps, ranged from 26 (Scottsdale, Arizona) to 81 (Garland, Texas). But even among cities with high inclusion scores, pronounced racial gaps are evident. In Garland, for example, prosperity is not equitably shared, as illustrated in the chart below. In every indicator category, scores for Black and Latinx residents trail those for the White population.

Latinx residents in Garland experience the deepest inequities in Economic Vitality and Readiness indicators.
The city-level prosperity scores span an even broader range, from 8 (Detroit, Michigan) to 78 (Fremont, California — a Bay Area suburb). This reveals the stark differences in economic and social outcomes in the wake of the Great Recession, as the recovery was very uneven and concentrated wealth and prosperity in a small number of regions (such as the San Francisco Bay Area) while legacy and post-industrial regions continued to struggle.

Top 10 Cities Concentrated in the West and Southwest

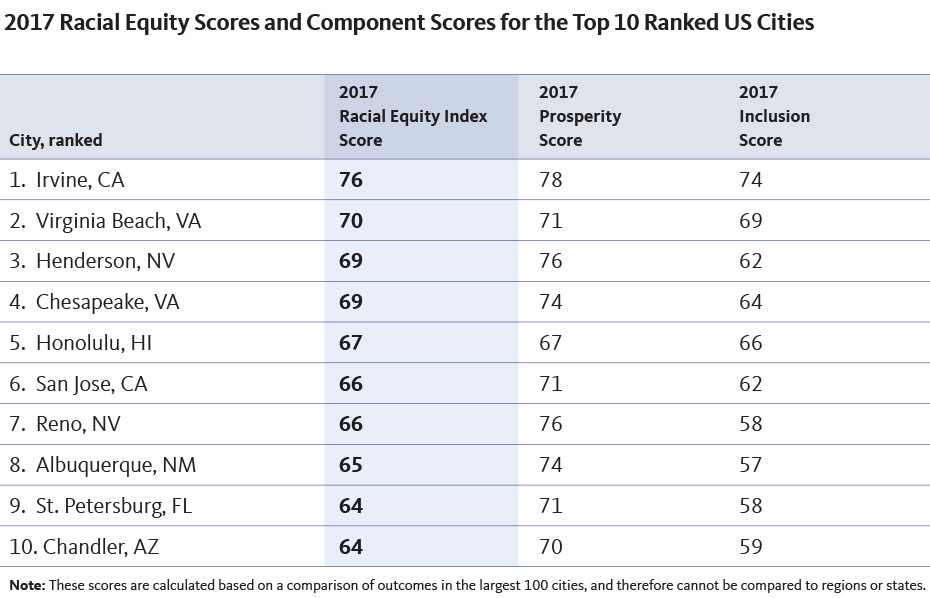
The table below shows the top 10 cities on the Racial Equity Index for 2017, as well as the inclusion and prosperity scores for each place. The cities on this list represent a diversity of local economies, from those dominated by manufacturing, transportation, and tourism to others specialized in financial services, energy technology, and aerospace.

Some of the top 10 cities (such as Irvine and Virginia Beach) have high Racial Equity Index scores driven by high scores for both inclusion and prosperity. In these places, overall population outcomes are, on average, better and more racially equitable than in other cities.

Other cities on the list (like Reno and Albuquerque) have high inclusion scores but much lower prosperity scores, indicating that while racial gaps are relatively small in these cities, overall population outcomes trail those in other places.
1. Irvine, California

Irvine earned the top spot on the Racial Equity Index for cities in 2017 with the sixth-highest inclusion score among cities and the third-highest prosperity score. In other words, it performed quite well in terms of both overall outcomes and in terms of racial inclusion.

Irvine’s top ranking is driven by its standout scores in the Readiness category: educational attainment, disconnected youth, and school poverty. The city ranked #1 for prosperity (overall outcomes) in educational attainment (BA degree or higher), and #2 for racial inclusion in educational attainment. It was also at the top of the lists for overall lowest levels of school poverty (#1) and disconnected youth (#2).

Yet Irvine is not without its challenges, with average or below-average prosperity scores in the Connected category: air pollution exposure (#51), commute time (#50), and rent burden (#74): more than half of renter households in Irvine spend more than 30 percent of their income on housing costs. And while the city had a high prosperity score for poverty/economic insecurity (#10), it ranked #73 out of 100 for inclusion on the same indicator: 46 percent of Latinx immigrants in Irvine are economically insecure, meaning they have family incomes below 200 percent of the federal poverty level — about three times the rate of US-born White residents (16 percent).

8. Albuquerque, New Mexico

Albuquerque was ranked #8 on the 2017 Racial Equity Index, with the #17 inclusion score and the #32 prosperity score.

The city had slightly above-average prosperity scores (overall outcomes) in median wages (#40) and unemployment (#46), but ranked in the top quarter of cities in terms of racial inclusion for these indicators. The city’s inclusion scores for median wages (#22) and unemployment (#21) signal that Albuquerque has smaller racial gaps for these important Economic Vitality indicators than most of its peer cities. Still, the median wage of Native American workers ($15 per hour) is far lower than that of White workers ($24 per hour). In fact, the median wage for Native American workers in Albuquerque is $2 less per hour than the national average for Native Americans, while the median wages for White, Black, and Latinx workers in Albuquerque are all higher than the respective national averages.

On other measures, however, Albuquerque is less racially inclusive. The city’s inclusion scores were just above average for economic insecurity (#43) and disconnected youth (#44), although 24 percent of Native American youth in the city are neither working nor in school — twice the rate for White youth. And while it scored well on prosperity for air pollution exposure (#17), its inclusion score for that indicator was near the bottom of the list (#93) due to large racial gaps.

9. St. Petersburg, Florida

St. Petersburg ranked ninth on the 2017 Racial Equity Index for cities, with the #29 inclusion score and the #27 prosperity score.

In 2017, St. Petersburg placed above the median prosperity score for seven of the nine indicators in the index, but landed in the bottom half of cities for disconnected youth (#57) and rent burden (#57).
St. Petersburg’s most positive showing was on the Economic Vitality indicator of economic insecurity. Its prosperity score (#23) and inclusion score (#20) were both relatively high, landing the city in the top 25 for both overall population outcomes and relatively smaller racial gaps in economic insecurity, but steep inequities are still evident: 55 percent of US-born Black residents and 45 percent of US-born Asian or Pacific Islander residents in St. Petersburg are economically insecure, compared to 27 percent of the US-born White population.

St. Petersburg had the nation’s fifth-highest inclusion score for educational attainment, but the share of adults with at least a bachelor’s degree ranged from 15 percent for Black men to 47 percent for Asian or Pacific Islander women.

Many Legacy Cities Among the Bottom 10 on the Racial Equity Index

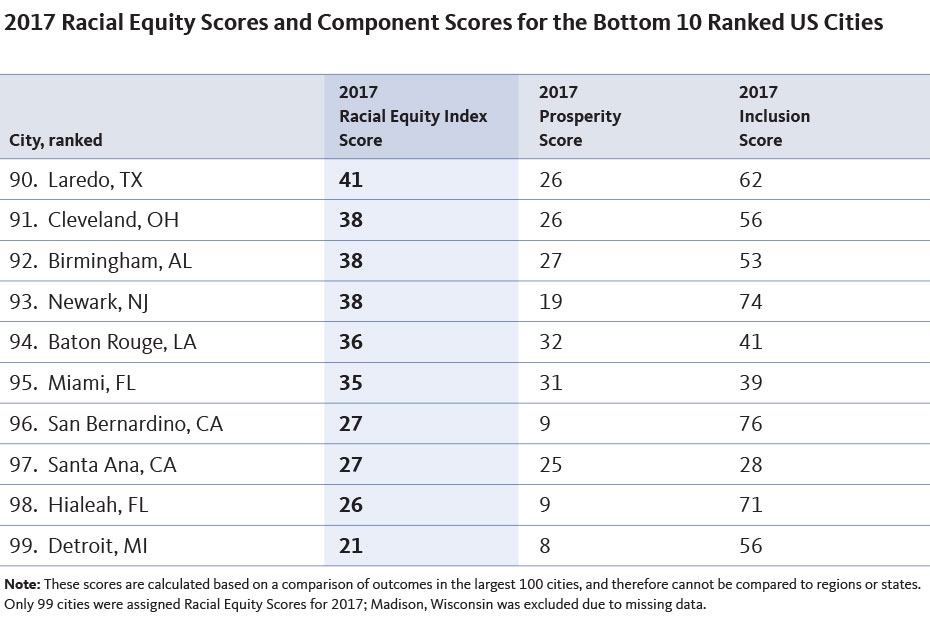
The table below shows the bottom 10 cities on the Racial Equity Index for 2017, as well as the inclusion and prosperity scores for each place. Several of these places could be categorized as “Legacy Cities” that struggled to recover from the decline of manufacturing and significant population loss even before the Great Recession. While a few of these places — Newark and San Bernardino, notably — have high inclusion scores comparable to the top-ranked cities — their very low prosperity scores indicate that their smaller racial gaps are accompanied by widely shared hardship.
94. Baton Rouge, Louisiana

In 2017, Baton Rouge was ranked #94 on the Racial Equity Index for cities, with the #91 inclusion score and the #87 prosperity score.

Baton Rouge simultaneously had the lowest prosperity score in the nation for air pollution exposure and the highest inclusion score for the same indicator, meaning the overall outcomes were the worst among the 100 largest US cities, and affected all racial/ethnic groups similarly.

Baton Rouge’s highest prosperity scores were for commute time (#23) and disconnected youth (#29), indicators that returned two of the city’s lowest inclusion scores: #75 for commute time and #98 — last place — for disconnected youth. Overall, 11 percent of youth in the city are neither working nor in school, but the share varies tremendously by race: among Black youth in the city, 20 percent are disconnected from work and school — 10 times the rate of their White peers (2 percent).

96. San Bernardino, California

In 2017, San Bernardino had the ninth highest inclusion score among the 100 largest cities, but the third lowest prosperity score. San Bernardino trails behind almost every other large city for overall population outcomes.

San Bernardino landed among the bottom five lowest prosperity scores on seven of the nine index indicators, but White residents — who make up just 15 percent of the city’s population — fare much better than other racial/ethnic groups. In 2017, the prosperity score for the White population in San Bernardino was 33 — far below the national median, but significantly higher than the scores for the Black (10) and Latinx (9) populations in the city.

99. Detroit, Michigan

Detroit ranked at the bottom of the 2017 Racial Equity Index for cities, with the lowest prosperity score and the 26th lowest inclusion score. In essence, overall population outcomes in Detroit are the worst in the nation, and racial inequities are especially pronounced.

The city’s low prosperity score is driven by the Economic Vitality indicators (median wage, unemployment, economic insecurity) and the Readiness indicators (educational attainment, disconnected youth, and school poverty). Detroit ranked in the bottom seven out of 100 cities on all of these indicators. Economic insecurity has increased significantly for all racial/ethnic groups in Detroit over the past few decades: in 2017, 72 percent of Asian or Pacific Islander households and 72 percent of Latinx residents in the city had family incomes below 200 percent of the federal poverty level, along with 62 percent of Black residents and 59 percent of White residents.

Targeted Solutions that Prioritize the Most Impacted Communities Are the Key to Thriving, Equitable Cities

Strategies tailored to advance just and fair inclusion for the communities most impacted by structural racism and economic inequality are not only the morally right thing to do — they are also the best way to ensure greater prosperity and well-being for all. Directing resources and innovation to where the need is greatest can create tremendous benefits that cascade up and out to the advantage of an entire city. But entrenched racial inequities are often obscured in policymaking and public discourse, making it difficult to home in on the systems and populations that ought to be prioritized. The Racial Equity Index offers an innovative tool to unlock the power of disaggregated data and make the case for policies to cultivate equitable cities where all people can participate, prosper, and reach their full potential.

Fewer and Fewer Small Businesses Are Getting Federal Contracts

Our analysis of federal data shows that the number of small businesses contracting with the federal government shrank dramatically over the past decade and federal purchasing — and the economic opportunities it generates — is highly concentrated in just a few congressional districts.

By Sarah Treuhaft, Eliza McCullough, Michelle Huang, and Tracey Ross

The federal government is the nation’s largest purchaser of goods and services, spending more than half a trillion dollars on contracts every year. This buying power is a crucial catalyst for equitable economic development across the country, creating scores of opportunities for businesses along a vast supply chain. Recognizing the value of its purse, the federal government has an official policy to ensure that small businesses, as well as entrepreneurs who face systemic barriers to business development and growth, have “maximum practicable opportunity” to access these contracting opportunities. 

In 2020, the federal government spent 26 percent of its contracting budget on small businesses (a total of $145.7 billion), exceeding its goal of 23 percent. Yet, our review of federal data reveals that while the total dollar amount going to small businesses has increased, the number of small businesses doing business with the federal government has plummeted over the past decade. About forty percent fewer small businesses fulfilled federal contracts in 2020 compared with 2010, and every year, fewer and fewer small companies sell their goods and services to the federal government. 

This dramatic decline in contracting opportunities matters because of the outsized role that small businesses — and particularly small businesses owned by people of color — must play in an equitable recovery and economic future. Research has shown that in the face of chronic labor market discriminationsegregation, and disinvesment in communities of color, businesses owned by people of color are more likely to hire people of color than other firms and also generate increased economic activity in communities of color. Entrepreneurship can also help close the racial wealth gap. But while workers of color start businesses at above-average rates, persistent barriers to accessing capital, networks, and business support translate into lower revenue growth for entrepreneurs of color. Federal contracting is an important pathway for business expansion and growth that can have ripple effects in communities that bear the heaviest burdens of structural racism and were hit hardest by the pandemic.

Here are key findings from our review of the data.

There has been a dramatic decline in the number of small business doing business with the federal government over the past decade

In 2010, about 125,000 small businesses contracted with the federal government. That number has shrunk year after year and by 2020, just under 76,000 small businesses fulfilled federal contracts — a 39 percent decline. Although a larger share of federal contracts are going to small businesses, fewer small businesses — and fewer communities — are benefiting from these business opportunities.

In addition to the shrinking overall number of small businesses contracting with the federal government, fewer small businesses are newly entering into federal contracts. While the federal government contracted with 23,000 new small business vendors in 2012, in 2019 just 9,400 new small businesses entered the federal marketplace.

Less than 16 percent of total government procurement is from small businesses owned by people of color and women

Today, people of color are 39 percent of the population and own 29 percent of all American businesses, yet entrepreneurs of color receive less than 12 percent of federal government contracting dollars.* While this exceeds the official contracting goal of five percent, it is far from being proportionate and even further from proactively advancing racial equity in business ownership. And while women own 42 percent of American companies and women of color start businesses at the fastest rate of all racial/gender groups, the federal government fell shy of meeting its 5 percent contracting goal for small women-owned businesses in 2020.

Federal contracts with small businesses are highly concentrated in just a few communities — exacerbating spatial inequities

Examining the geographic spread of federal contracts to small businesses, we found that federal contracts are highly concentrated in just a few congressional districts. There are 17 congressional districts that each had more than $1 billion in small business contracts with the federal government in 2020 — 12 of them in Virginia and Maryland. While federal contracts do go to businesses located in every congressional district, these 17 districts — which are home to just four percent of the population — received 43 percent of small business procurement. As economic opportunity continues to concentrate in a smaller number of communities, achieving greater spatial equity in federal procurement is a critical strategy to foster shared prosperity and an inclusive recovery.


The Build Back Better Plan offers solutions to unlock contracting opportunities for small businesses and entrepreneurs of color

As Congress debates more than $4 trillion in spending on infrastructure and President Biden’s “Build Back Better” agenda, leveraging federal procurement to strengthen and rebuild local economies is a public and policy priority. One element of the proposed Build Back Better Plan is a set of programs through whic the Small Business Administration will partner with Historically Black Colleges and Universities (HBCUs) and other institutions that serve communities of color to uplift the next generation of Black-, Latinx-, and Tribal-owned small businesses through federal contracting. Together, these programs would invest $2.4 billion over ten years to establish business incubators and business development programs in underrepresented communities and support small businesses to meet evolving technological needs. 

A 2019 pilot conducted with the Bowie State University, an HBCU, shows that this type of support works: the University's accelerator program worked with 32 companies that went on to secure $26 million in government contracts. 

Given the clear trend of declining contracting opportunities, this plan to democratize access to federal contracts and foster inclusive business development is a timely intervention to ensure an equitable recovery and economic future.


*The federal government sets contracting goals for “small disadvantaged businesses” which are at least 51 percent owned by one or more people “who have been subjected to racial or ethnic prejudice or cultural bias within American society because of their identities as members of groups and without regard to their individual qualities.” 

January 2023

Advancing Workforce Equity in Miami: A Blueprint for Action

Overview

South Florida’s economic rebound from the Covid-19 pandemic has been turbulent, driven by persistent barriers to quality employment prospects for residents of color and an elevated risk of automation-driven job displacement. This report—produced in partnership with Florida International University and Lightcast, with support from JPMorgan Chase—examines the economic costs of these upheavals and ongoing racial economic exclusion in the Miami metropolitan region. Our in-depth analysis of disaggregated equity indicators and labor market dynamics found that Black workers and Hispanic women have the lowest median wages at $16 per hour, while white men earn the highest median wages at $27 per hour—a 69 percent pay gap. The research also indicates that eliminating racial gaps in wages and employment for working-age people could boost the region's economy by $122 billion a year. The report concludes with several strategies to advance workforce equity in South Florida and to ensure that all workers, including those who face the additional burdens of systemic racism, are prepared for the jobs of tomorrow with the skills, supports, and access they need to fully participate and thrive in the economy. Download the report.

September 2022

Advancing Workforce Equity in Metro Detroit: A Blueprint for Action

Overview

In the years following the Great Recession, Metro Detroit showed promise of a strong economic rebound. But new research shows that the region’s recovery was racially uneven, and persistent racial inequities in housing, income, and other key measures of well-being have constrained the region’s economic growth. This report, produced in partnership with the Detroit Area Workforce Funders Collaborative and Lightcast, with support from JPMorgan Chase illustrates how long-standing racial gaps in income and employment have impacted the region’s workforce and economy: The region has a shortfall of good jobs that do not require a college degree and only 29 percent of the region’s workers hold good jobs. Despite the growing diversity of the region's workforce, workers of color remain crowded in lower paying and lower opportunity occupational groups, while white workers are overrepresented in many higher paying professions. These persistent inequities cost the region an estimated $28 billion in lost economic activity per year. The report concludes with a strategic roadmap for the region to advance workforce equity, which was developed in partnership with a local advisory group of policymakers, employers, educators, training providers, community-based organizations, and advocates. Download the report.

Additional resources:

Media: New Research Reveals that Black Workers Have Borne the Brunt of Metro Detroit’s Inequitable Labor Market and Uneven Economic Growth (Press Release)

August 2022

Advancing Workforce Equity in Nashville: A Blueprint for Action

Overview

Nashville’s strong and sustained growth has helped make it Tennessee’s largest city and the state’s biggest economic powerhouse, but racial inequities in the workforce threaten the region’s future prosperity. This report, produced in partnership with the Urban League of Middle Tennessee and Lightcast, with support from JPMorgan Chase, offers a comprehensive look at the racial inequities in workforce outcomes that have long persisted in the Nashville metropolitan region. It also underscores how the Covid-19 pandemic is impacting these dynamics and how automation is projected to affect industries and workers in the area. Our in-depth analysis of disaggregated equity indicators and labor market dynamics found that only about 41 percent of the region’s 915,000 workers hold good jobs, that white workers with only a high school diploma earn higher median wages ($17/hour) than Black workers with an associate’s degree ($16/hour), and that eliminating racial inequities in employment and wages could boost the Nashville economy by $9.5 billion a year. The report concludes with actionable solutions to advance workforce equity across the region, informed by these findings and shaped by local leaders. Download the report.

Media: Here's a Blueprint for How Nashville Can Achieve Workforce Equity (The Tennessean)

May 2022

Advancing Workforce Equity in Columbus: A Blueprint for Action

Overview

The Columbus regional economy is strong and growing quickly, but racial inequities in the workforce threaten the region’s future prosperity. This report, produced in partnership with Emsi Burning Glass, One Columbus, and the Workforce Innovation Center, provides a comprehensive analysis of long-standing racial gaps in labor market outcomes, the economic impacts of Covid-19, and the racial equity implications of automation. Our in-depth analysis of disaggregated equity indicators and labor market dynamics found that only 42 percent of the region’s workers are in future-ready jobs, that Black workers with an associate’s degree earn on average the same wages as white workers with just a high school diploma, and that eliminating racial inequities in income could boost the Columbus regional economy by about $10 billion a year. The report concludes with actionable solutions to advance workforce equity across the region, informed by the data and shaped by local leaders. Download the report.

Media: Racial Inequities Cost Columbus Economy $10 Billion a Year, Report Finds (The Columbus Dispatch)

The California Immigrant Data Portal: Tracking Progress and Informing Strategy For a More Inclusive and Equitable California

The California Immigrant Data Portal provides data and case studies to better understand and promote the well-being of immigrants, their families, and their communities.

The California Immigrant Data Portal (CIDP), a project of the Equity Research Institute (ERI) at USC, is a resource and progress tracker for immigrants and those serving immigrant communities in California. CIDP provides data and case studies to better understand and promote the well-being of immigrants, their families, and their communities. Indicators on the portal are organized into four categories, including demographics and three critical components of immigrant integration: economic mobility, warmth of welcome, and civic participation. CIDP’s indicators and data summaries draw from federal, state, and local data sources and include current and historical data for counties, sub-county areas, cities, and the state, disaggregated by immigration status, race, and ancestry. 

CIDP data is available for the nine counties in the Bay Area region (Alameda, Contra Costa, Marin, Napa, San Francisco, San Mateo, Santa Clara, Solano, and Sonoma counties) and for six large Bay Area cities including Antioch, Fremont, Oakland, San Francisco, San Jose, and Sunnyvale. Available demographic data includes nativity, undocumented immigrants, arrival in the US, and refugees. Indicators of immigrant integration include economic contributions, education, employment, occupation, wages, housing burden, English fluency, deportations, and hate crimes. Learn more about the California Immigrant Data Portal here

ERI developed the Bay Area Equity Atlas in partnership with the San Francisco Foundation and PolicyLink. ERI’s work centers on promoting narratives to support the integration of diverse communities, immigrant and US-born alike; lifting up the intersection of racial justice and immigrant rights; and strengthening the base for inter-sectoral collaborations. ERI’s immigrant integration work is anchored by three guiding principles:

  • Immigrant integration is everyone’s business;

  • Successful immigrant integration can only happen when we lift up racial justice and address longstanding inequities; and

  • California must lead on immigrant integration and seek to provide a model for the rest of the nation.

Learn more about ERI here.

Homeownership is Unattainable for Most Bay Area Black, Latinx, Cambodian, and Pacific Islander Households

Our analysis of data on homeownership rates across the nine-county Bay Area reveals persistent inequities in access to wealth-building opportunities across race, nativity, ancestry, and place.

Homeownership can be a critical pathway to economic security and mobility, helping lower-income people build wealth that can be used to pay for education or other productive investments — but it remains out of reach for too many households, especially low-income people of color. This month, we added Homeownership as the 22nd indicator on the Bay Area Equity Atlas to democratize data on  homeownership rates by race, gender, nativity, ancestry, and geography between 2000 and 2019, the most recent year for which this data is available. This analysis highlights key insights from this data from the Great Recession through the long economic recovery until right before the Covid-19 pandemic. 

Nearly two-thirds of White households in the region own their homes — nearly twice the share of Black households 

There are stark differences in homeownership rates by race/ethnicity. Across the broad racial/ethnic groups, White households in the Bay Area are most likely to own their homes (63 percent) — nearly twice as likely as Black households (34 percent). Homeownership rates are also lower for Latinx (40 percent), multiracial (45 percent), and Native American (46 percent) households. 

Although six in 10 Asian or Pacific Islander (API) householders own their homes, large disparities are evident within this diverse population. Analyzing homeownership rates by ancestry shows that less than half of Pakistani (43 percent), Laotian (45 percent), Thai (46 percent), Korean (46 percent), and Pacific Islander (41 percent) households own their homes. Cambodian households have the lowest rate of homeownership among API households at 39 percent, though it is important to note that this represents significant progress since 2010 when just 29 percent of Bay Area’s Cambodian population owned their own homes. Taiwanese households have the highest rates of homeownership (72 percent) among API households and across all racial/ethnic ancestry groups. Disparities by ancestry within the Asian or Pacific Islander population in the Bay Area often hold true for other markers of economic security as well.

Racial disparities in homeownership stem in part from income gaps between White households and households of color. Median earnings for Black, Latinx, Native American, and multiracial households in the Bay Area fall below $55,000 per year, whereas White households earn a median annual income of $92,100. The median annual income of Asian or Pacific Islander households is $82,300, but given the diversity of this group, earnings vary considerably across API communities by ancestry. 

Black households are the only racial/ethnic group in the Bay Area that experienced consistent declines in homeownership, while Latinx households experienced the largest post-foreclosure crisis dip in homeownership rates  

Homeownership rates across the region, which held steady between 2000 and 2010, declined slightly from 58 to 56 percent over the last decade. This drop stems from the rise in renting after the foreclosure crisis, increase in housing costs, and stagnant wages, especially for low- and middle-wage workers. Regional and statewide rates are similar (56 percent compared with 55 percent statewide) and followed a similar trend over the last two decades. 

In 2000, 41 percent of Black households in the region owned homes; but by 2010 the share had declined to 37 percent, and by 2019 only 34 percent of Black households owned their homes. Black homeownership rates also declined over both of these time periods in Alameda, Contra Costa, and Santa Clara counties, in the city and county of San Francisco, and in the cities of Oakland and San Jose. 

For Bay Area Latinx households, the share of homeowners increased between 2000 and 2010 (from 45 to 46 percent), but then declined by 2019 to 40 percent — the largest post-foreclosure-crisis decline in homeownership of any racial/ethnic group. This steep decline also held true for large cities including Fremont, Oakland, San Francisco, San Jose, and Sunnyvale, and for all counties except for Marin and Napa.

Following overall regional trends, the share of White homeowners increased slightly between 2000 and 2010 but experienced a small dip the following decade. Trends were similar for White homeowners in Oakland, San Francisco, and Sunnyvale, with little variation across counties. 

Contrary to overall regional trends, the share of API homeowners in the region rose slightly over each time period. This was also true across most counties. Trends in API homeownership varied across large cities including Fremont, Oakland, San Francisco, San Jose, and Sunnyvale, likely due to the diversity of API populations across those communities. 

Unlike most other racial/ethnic groups, the share of Native American homeowners in the region decreased slightly between 2000 and 2010 and rose over the last decade. Data on homeownership rates for Native American households is unavailable for large cities and most counties due to small sample size.

Between 2000 and 2019, The largest decline in homeownership rates across race/ethnicity was among Black homeowners in Solano County (down 10 percentage points). Black homeowners also saw the largest declines in Contra Costa (-8 percentage points), Santa Clara (-8 percentage points), and San Francisco (-7 percentage points) counties. Black and Latinx homeowners were hardest hit in Alameda County (each down 7 percentage points), while Latinx homeowners experienced the largest decline in homeownership in Sonoma County (-6 percentage points). Multiracial residents experienced the largest decline in homeownership rates in San Mateo (-9 percentage points) and Marin (-4 percentage points) counties. Data is unavailable for most racial/ethnic groups in Napa County due to small sample size.

Native American households in Alameda County experienced the largest gains in homeownership rates between 2000 and 2019 (increased 10 percentage points), followed by Latinx households in Napa (+8 percentage points), Asian or Pacific Islanders households in Marin County (+7 percentage points), and multiracial households in Sonoma County (+ 6 percentage points). 

Although nearly half of Native American households own their homes, there is a large gender gap

Examining homeownership rates by both race and gender reveals that Native American men are much more likely to own homes compared with Native American women — 54 percent versus 38 percent, respectively. There is also a gap among Black and multiraical homeowners across gender, with Black men and multiracial men more likely to own than women. There are narrower differences in homeownership rates for men and women among other racial and ethnic groups.

Immigrants (especially Black and Latinx immigrants) are less likely to reap the benefits of homeownership than their U.S.-born counterparts

Except for Asian or Pacific Islander immigrants, Bay Area immigrants across all racial and ethnic groups are less likely than their US-born counterparts to own homes. Although Black and Latinx immigrants are least likely to be homeowners (31 and 36 percent, respectively), U.S.-born Black and Latinx households as well as Native American and multiracial households overall have much lower homeownership rates than both immigrant and U.S.-born White and Asian homeowners. Across ancestry, people of Ethiopian/Eritrean ancestry are least likely to own their homes among all racial and ethnic ancestries in the region: just 18 percent of Ethiopian or Eritrean households own homes. Guatemalan households also have one of the lowest homeownership rates at 22 percent. 

Black, Latinx, and White immigrants in the region have lower homeownership rates than their US-born peers. Among Black immigrant homeowners, Ethiopian or Eritrean immigrants have the lowest homeownership rates (18 percent) based on available data. Guatemalan (20 percent), Mexican (35 percent), Salvadoran (35 percent), Peruvian (37 percent), and Nicaraguan (37 percent) immigrant homeowners tend to have lower homeownership rates than their US-born Latinx counterparts. Although 64 percent of US-born White households own homes, 56 percent of White immigrants own. Immigrant homeowners who are Turkish (39 percent), Ukrainian (43 percent), Romanian (43 percent), Russian (46 percent), French (53 percent), Canadian (54 percent), and Iranian (56 percent) tend to be less likely to own compared with their US-born White peers.

Racial disparities in homeownership persist across income levels

While higher incomes correlate with higher levels of homeownership, racial inequities persist even when you look at households with similar incomes, revealing how structural racism perpetuates the generational racial wealth gap. Looking at households in the region earning below 350 percent of the federal poverty level — the threshold that the Bay Area Equity Atlas uses for economic insecurity — we still see large disparities in homeownership rates across race. Nearly half of economically insecure White households own homes, which is more than double the share of economically insecure Black households.

People of color still bear the brunt of racist housing policies that locked people out of homeownership opportunities and economic mobility

As an asset-building tool, homeownership depends on access to affordable, sustainable mortgage financing as well as home appreciation rates, both of which are affected by discriminatory lending practices and racial segregation. Wealth also plays a significant role in homeownership and vice versa, and the racial wealth gap is notably larger than the income gap. The long history of racial oppression and segregation in the United States, through which people of color have been dispossessed and excluded from economic prosperity, has contributed to a large racial wealth gap: In 2016, the median net worth of White households was $143,600 but only $21,420 for Latinx households and $12,920 for Black households. 

This racial wealth gap, along with racist housing policies such as redlining (denial of home loans in Black neighborhoods) and racially restrictive covenants that barred Black residents and other people of color from purchasing homes, prevented generations of people of color from becoming homeowners. As homeownership remains one of the most widely available and effective ways to increase wealth over generations, the lack of parental homeownership within communities of color today further diminishes the wealth of the current generation and their ability to purchase a home. 

To make matters worse, people of color, and Black residents in particular, have been  disproportionately impacted by both the foreclosure crisis that fueled the Great Recession and the current economic fallout from the Covid-19 pandemic. The impact of the foreclosure crisis on these largely Black and Latinx households was especially devastating. Nationwide, the foreclosure crisis obliterated Black and Latinx median net worth by an estimated 44 and 48 percent, respectively, between 2007 and 2013. In the Bay Area and across the country, lenders targeted predatory home loans in Black neighborhoods, filling a void in home financing created from redlining decades earlier. Even among applicants with similar credit and financing profiles, the share of Bay Area Black and Latinx households receiving subprime loans was double and more than triple that of White households, respectively. More recently, the onset of the Covid-driven recession has disproportionately impacted communities of color and lower-income communities who have suffered the greatest job losses and mortgage defaults, adding to the catastrophic health impacts of the pandemic. 

Grow an equitable economy: Policies to increase sustainable homeownership

Several strategies exist to expand and sustain homeownership opportunities for immigrants, women, and people of color, especially Black and Latinx households. These strategies include promoting shared equity homeownership models, such as community land trusts, Tenant Opportunity to Purchase policies (TOPA), and limited equity cooperatives; providing down-payment assistance programs for low- and moderate-income homebuyers; enacting a strong homeowner bill of rights; and preventing foreclosures and helping households and neighborhoods recover from them. Learn more about homeownership rates in your community, including additional strategies to address persistent inequities, by exploring the homeownership indicator on the Bay Area Equity Atlas.

Everyone Wins When Our Elected Officials Reflect the Diversity of the Region

While California congratulates Governor Newsom for keeping his post in the recall election last week, we’re taking a moment to appreciate Californians for showing up to vote for our shared future. Voter turnout is always difficult, important work — and one of the difficulties in turning people out to vote in the recall election was that people don’t feel represented by their elected officials.

By Michelle Huang and Kimi Lee of Bay Rising

Our region’s biggest problems — overpolicing in Black, Indigenous, and people-of-color communities, violence against Asian American and Pacific Islander elders, working-class people and renters being left behind during the pandemic — all require community-led voices and solutions. Especially in the context of local budget shortfalls, having elected officials with knowledge of the experiences of our communities is key to  more equitable distribution of resources and priorities.

This is why we need people in office who reflect our diversity and values — including people who are Black, Latinx, Asian, immigrants, queer, and people with disabilities. While representation does not automatically mean equitable policies, it can make a difference. For instance, in San Jose in June 2021, where all districts are majority of-color, the six city councilmembers of color voted to defer the decision on the Berryessa BART Urban Village Plan in support of Latinx organizers’ and La Pulga vendors’ ability to negotiate for fairer agreements, while the four white city councilmembers and the mayor voted against it. La Pulga is home to over 400 largely Latinx and Asian-owned businesses.

For the past four years, the Bay Area Equity Atlas has tracked data on the diversity of elected officials in the Bay Area. Our analysis from the 2020 elections found that across the region, voters elected more people of color to office, following a steady trend over several years. About 34 percent of top elected officials in the Bay Area are now people of color, up from 29 percent in 2019 and 26 percent in 2018.

Despite this steady increase, people of color remain vastly underrepresented, given that they are roughly two-thirds of the Bay’s population. And just over a quarter of Bay Area cities still have zero people of color on their councils.

There is still much work to do. Corporate money, funneled into local elections and coupled with limited access to expertise and financial support for new candidates, makes it challenging for everyday people, renters, community leaders, and people not well-connected to political parties to run and win campaigns.

We know the solutions. We need campaign finance reforms, leadership development programs for those historically excluded from power, and more voter education and voting options to grow the number of community candidates running for office as well as voter participation.

Of these, campaign finance reforms stand out as especially timely. The 2020 federal elections saw more Wall Street financing than any other election cycle in US history, but that corporate money wasn’t reserved for just the presidential race — many millions showed up in both state and local races in the Bay, making it extremely hard for a diversity of candidates to run viable campaigns. For example, in 2020, wealthy donors raised over $300,000 to spend on Oakland school board races, where those same races used to be won with campaigns spending thousands of dollars, not hundreds of thousands. To counteract this trend, we need campaign finance reform that sets limits on corporate contributions, requires transparent budgets and ads, and promotes public financing.

Bay Area policymakers must pass policies that result in more candidates from underrepresented communities getting elected to city and county offices. We deserve to be represented by leaders who reflect our realities.

Kimi Lee is the Executive Director of Bay Rising, a regional alliance of over 30 Bay Area grassroots organizations building political power among working-class people and communities of color. Michelle Huang is an Associate with PolicyLink who provides data and research support as part of PolicyLink’s National Equity Atlas team.

September 2021

Mid-Hudson Valley Tenant Protection Fact Sheets

Overview

A series of fact sheets was created in partnership with For the Many (formerly known as Nobody Leaves Mid-Hudson), to support their work in the Mid-Hudson Valley region to advance policies that build more stable communities and protect renters from unfair evictions and predatory landlords. Key findings include:

  • Housing insecurity is a region-wide issue: 54 percent of renter households in the Mid-Hudson Valley are rent-burdened. Black and Latinx renters are especially impacted.
  • The majority of renters in Beacon, Kingston, Newburgh, New Paltz, and Poughkeepsie are rent-burdened – meaning that they spend more than 30 percent of their income on housing costs.
  • In these places, Black, Latino, and other people of color are much more likely to be rent-burdened compared to white renters. In New Paltz, 100 percent of Black renters are rent-burdened compared to 68 percent of white renters.

You can download fact sheets for the following places: Ulster County, Beacon, Kingston, Newburgh, New Paltz, and Poughkeepsie.

Learn more about For the Many.

Pages