#4191ca

June 2020

Race, Risk, and Workforce Equity in the Coronavirus Economy

Overview

Over a span of less than three months, the COVID-19 pandemic has radically upended the lives and livelihoods of millions of workers and their families. But while the pain has been widespread, it has not been equally shared: workers of color and immigrant workers are being hardest hit by the loss of jobs and income, and women of color especially are disproportionately employed in the lowest-wage, essential jobs that place them at risk of contracting the virus. In order to inform equity-focused relief and recovery strategies, this report offers a comprehensive, disaggregated analysis of the labor market effects of the coronavirus in the United States and ten metro regions: Boston, Chicago, Columbus, Dallas, Detroit, Miami, Nashville, San Francisco, and Seattle. This analysis was produced through a partnership between the National Equity Atlas and Burning Glass Technologies. Read the report and download the underlying data.

Media: Mounting Unemployment Crisis Fuels Racial Wealth Gap (Politico), COVID-19’s Economic Fallout Is Hitting The Black Community Hard, Too (HuffPost), Here's How The Coronavirus Pandemic Changed The Way Columbus Residents Spend Money (Columbus Business First). 

The Coming Wave of Covid-19 Evictions: A Growing Crisis for Families in Contra Costa County

Our analysis finds that 14,000 renter households are at imminent risk of eviction if the county’s eviction moratorium expires, with more waves of evictions close behind.

By Jamila Henderson, Sarah Treuhaft, Justin Scoggins, and Alex Werth (East Bay Housing Organizations)* 

In the Bay Area, as elsewhere, the coronavirus and its economic fallout have disproportionately impacted the very same people that were on the economic margins before the pandemic, including Black, Latinx, and immigrant communities (especially undocumented workers), and low-wage workers. And they are about to face an additional threat: the risk of being evicted when they can’t pay rent because they’ve lost jobs and income because of the pandemic. 

Recognizing the immense harm posed by mass eviction amidst a global health and economic crisis, the Contra Costa County Board of Supervisors passed a moratorium on evictions and rent increases in April 2020, which it extended in May 2020. 

Since then, the pandemic has not abated. In fact, the county is now slowing down reopening plans amid escalating infection rates. Yet Contra Costa’s county-wide eviction moratorium is set to expire July 15, placing scores of renters who’ve suffered economic losses during the pandemic at risk of losing their homes. 

This analysis, produced in partnership with the Raise the Roof Coalition,** sheds light on the magnitude of this risk by estimating the number of renter households that could face eviction if the moratorium is allowed to expire. See the accompanying fact sheet.

Tens of Thousands of Households at Risk from Coming Waves of Evictions

Our analysis shows that lifting the moratorium at this moment would be disastrous, potentially unleashing a wave of evictions that would devastate workers, families, and their communities. We estimate that 14,000 Contra Costa County households are at imminent risk of eviction if the moratorium is allowed to expire because they include one or more workers who’ve lost their jobs and have no replacement income. Approximately 12,100 children living in these households would also face eviction.

These imminently at-risk households include workers who were either not eligible for unemployment insurance, such as the county’s undocumented immigrant workers and informal workers, or believed they weren’t eligible or faced language and technology barriers and other challenges in filing for benefits. About 65,000 Contra Costa County residents are undocumented immigrants. This is a conservative estimate of those most at-risk: many other households could face eviction if unprotected by the moratorium.

And this will just be the beginning. A second wave of evictions will occur when the Federal Pandemic Unemployment Compensation – which provides a $600 weekly supplement to all workers receiving unemployment benefits – expires on July 31, 2020. Without these additional benefits, about half of workers on UI will have replacement incomes below the federal poverty level, according to the California Policy Lab. This would place an additional 8,700 Contra Costa households at potential risk of eviction due to substantial income loss.   

These waves of evictions would come at a time when Contra Costa County is struggling with rising Covid-19 infections and unprecedented job losses. Contra Costa has seen a 65 percent weekly increase in infections as of July 7, one of the worst surges among the six Bay Area counties coordinating to fight Covid-19 (Alameda, Contra Costa, Marin, San Francisco, San Mateo, and Santa Clara). The county was recently added to the California Department of Public Health’s watch list of high-risk counties because of its high case rates and hospitalizations. Contra Costa County is also one of the hardest hit by the recession: 13.6 percent of workers (72,500) were officially unemployed as of May 2020. An additional 26,700 workers have dropped out of the labor force since January and aren’t even included in the official unemployment numbers.

Contra Costa County also has weaker emergency tenant protections than the other counties, except Marin, which is considerably more affluent. After the moratorium ends, Contra Costa renters will have just four months to repay the backlog of rent – potentially thousands of dollars on top of their regular rent – leaving tenants who face eviction with little recourse. In contrast, Alameda, San Francisco, San Mateo, and Santa Clara counties have repayment terms ranging from six to 12 months, with evictions for non-payment of rent due to Covid-19 banned altogether in Alameda and San Francisco. 

Karen from Raise the Roof during Renter Protection Caravan


Mass Eviction Would Devastate Families and the Community, Contributing to Rising Homelessness

Eviction is financially and emotionally devastating to families. It can cause serious harm to mental and physical health, including depression, and negatively affect children’s education. Given that the families imminently at risk of eviction have no income coming in, and most have little to no savings, many could become unhoused. Examining eviction risk in Los Angeles County, UCLA professor Gary Blasi estimated that 10 percent of those evicted due to Covid-19 would become homeless. In 2018, Contra Costa County provided services to 5,846 individuals and families experiencing homelessness; if 10 percent of the currently at-risk households became homeless, that would lead to a 21 percent increase in homelessness. This would cause immeasurable despair and disruption for families. And it would exacerbate the county’s racial inequities: already, Black people represent 34 percent of the county’s unhoused population though they comprise just 8 percent of county residents.

This steep rise in homelessness would also strain community resources, staff, and infrastructure. The county currently spends a minimum of $20,075 per year to shelter one individual. This expense would significantly increase with the potential rise in homeless individuals and families, and only represents a portion of the full costs of homelessness. Cities, nonprofits, housing agencies, and hospitals also provide many homeless services and would also need to allocate more resources to serve a larger number of people experiencing homelessness. Although not insignificant, monetary expenses understate the true costs and long-lasting repercussions of homelessness for individuals and families. 

Exacerbating the Housing Crisis for Black, Latinx, and Immigrant Renters

One in three Contra Costa households rent their homes, and this share has been on the rise. Even before the pandemic, the majority of renters in Contra Costa County were already being squeezed by stagnant wages and rising rents, with 53 percent of them rent-burdened, defined as spending more than 30 percent of their income on rent and utilities. 

Black, Latinx, and immigrant residents in Contra Costa County are not only more likely to rent versus own their homes, but also more likely to pay too much for their housing. Black and Latinx renters, especially women, face greater risks of eviction and homelessness, as they are more likely to be economically insecure and rent-burdened: 64 percent of renter households headed by Black women and 56 percent of those headed by Latina renters are economically insecure and rent-burdened. As a comparison, only 37 percent of renter households headed by White women and 38 percent of those headed by men of all races/ethnicities experience these conditions.

Renters in Contra Costa continue to face rising economic and housing insecurity, which this crisis has underscored and exacerbated. To make matters worse, nationwide, rent-burdened households have an average savings of just $10, which is grossly insufficient to cover emergency expenses and contributes to the imminent risk of mass eviction. 

A Preventable Crisis

Without an effective eviction moratorium and tenant protections, vulnerable renters are at risk of losing their homes. Contra Costa County can only thrive if its renters thrive, and community leaders and policymakers must take every step possible to prevent this potential humanitarian crisis from occurring. 

The county can protect renters with these key strategies:

  1. Extend the eviction moratorium until 90 days after the state of emergency ends. 

  2. Ban evictions for non-payment due to Covid-19, converting missed rent to consumer debt. 

  3. Increase rental assistance, tenant counseling, and legal services for low-income renters. 

  4. Pass just cause eviction protections and rent control to address gaps in state law. 

  5. Enact rent and eviction registries to evaluate current policies and ensure equity.

For additional data, and to learn more about how to protect renters in this crisis, read the fact sheet. See the methodology for our data sources and methods of calculating these estimates.

Last updated October 2, 2020.

* Alex Werth, Policy Associate at East Bay Housing Organizations, serves on the Equity Campaign Leaders Advisory Committee of the Bay Area Equity Atlas. East Bay Housing Organizations is a member of the Raise the Roof coalition which produced this analysis in partnership with the Bay Area Equity Atlas. 

** Raise the Roof is a coalition of community, labor, and faith groups working to bring good jobs, immigrant protections, and affordable housing to the City of Concord and Contra Costa County. Members include ACCE, California Nurses Association, Central Labor Council Contra Costa County-AFL-CIO, East Bay Alliance for a Sustainable Economy, East Bay Housing Organizations, Ensuring Opportunity, First Five/Central County Regional Group, Lift Up Contra Costa, Monument Impact, and Tenants Together. www.facebook.com/raisetheroofconcord.

From Suburbs to Cities, Police Violence is a Regionwide Issue

Our analysis of police use-of-force incidents in the Bay Area reveals that police violence affects wealthy suburbs as well as core cities.

We have witnessed repeatedly the disproportionate and unjust killing of Black men and women at the hands of police, and in nearly every case the police are neither arrested nor charged, and many remain on the force. The callous killing of George Floyd, a Black man, at the hands of a White police officer in Minneapolis has sparked protest across the country and the world, and has shifted public consciousness and given rise to policy changes few could have imagined possible just a few weeks ago. Public institutions in Minneapolis have cut ties with the police department and the city council has voted to take steps to disband the police, vowing to replace it with a new model of public safety and redirect funds to community-based strategies. Several Bay Area officials have also pushed for change, including San Francisco Mayor London Breed who called for funds to be diverted from police to Black communities, and the Oakland school board which voted to eliminate the Oakland Schools Police Department, an effort led by local advocates. 

In California last year, as a result of organizing and activism by families who lost loved ones to police violence, the state passed the California Act to Save Lives aimed at addressing the very issue of excessive police use of force. But much more is needed as shown by this month's unjust and fatal shootings of Sean Monterrosa by a Vallejo police officer and Erik Salgado by California Highway Patrol in Oakland, which has increased existing outrage.

This analysis takes a closer look at police violence against Black people in the Bay Area by looking at data provided by the police use-of-force indicator in the Bay Area Equity Atlas for the region’s 101 cities. This data, which originates from the Open Justice Data Portal from the California Department of Justice, describes the number and rate (per 100,000 people) of civilians involved in incidents with law enforcement (e.g., police and sheriff’s departments, state police) in which they sustained serious bodily injury or death, or in which law enforcement discharged a firearm at them, for the two-year period of 2016 and 2017 combined. Examining the rate allows for meaningful comparison across cities with differing population sizes. It is important to note that while this is the best data available for police use of force at the local level, it is not perfect: some use of force incidents in the Bay Area may not be included due to agency underreporting, particularly in the first year (2016) and the exclusion of records missing geographic or demographic information. 

Black Residents Make Up 6 Percent of the Region’s Population, but Account for 20 Percent of Use-of-Force Incidents 

In 2016 and 2017 combined, law enforcement agencies in 51 of the 101 Bay Area cities and towns reported use-of-force incidents. Within these 51 municipalities, 15 reported use-of-force incidents involved Black people. Black residents account for 6 percent of the population in the nine-county Bay Area, yet they are disproportionately the targets of police violence: One-fifth of the nearly 200 use-of-force incidents in the Bay Area involve Black people.

The Affluent, Suburban Communities of Pleasant Hill, Redwood City, and Dublin have the Highest Rates of Police Use-of-Force Incidents Involving Black People

Examining the 15 Bay Area police departments that reported use-of-force incidents involving Black residents, we see the highest rates in Pleasant Hill, Redwood City, and Dublin: affluent, suburban communities with relatively small Black populations (each 5 percent or less). There was one reported use-of-force incident involving a Black resident in Pleasant Hill, a rate of 169 per 100,000 given the small Black population there (2 percent). The Redwood City police department reported two use-of-force incidents involving Black people, which is a rate of 118 incidents per 100,000 people in a city with such a small Black population. In Dublin, there were three use-of-force incidents involving Black residents, a rate of 115 use-of-force incidents per 100,000 residents. All three cities had significant racial inequities in police use-of-force incidents, with very low rates of use of force involving White residents.


Benicia, Emeryville, San Ramon, Richmond, and Fremont also have a relatively high number of use-of-force incidents involving Black people, with each police department reporting one use-of-force incident involving a Black person, except for Richmond, which reported nine incidents and Fremont which reported two. In contrast, there were zero use-of-force incidents involving White people in Benicia, Emeryville, and San Ramon. These suburban and urban communities are fairly diverse and largely wealthy except for Richmond. 

The cities of San Leandro, Antioch, San Francisco, Vallejo, Vacaville, Pittsburg, and Oakland have lower rates of use-of-force incidents that involve Black residents, but some have higher absolute numbers of incidents. San Francisco, Oakland, and Antioch had the highest reported number of incidents involving Black people—six, five, and four incidents, respectively. Each of these communities (except for San Francisco), have a larger share of Black residents than the region as a whole (6 percent).

It’s a Matter of Life and Death

In the wake of the killing of George Floyd, activists have called for the defunding of the police as well as the removal of police from schools. Now is the time for bold policies that divest from policing and invest in communities

As this analysis shows, in the Bay Area, the issue of police violence is a regionwide one that affects wealthy suburbs as well as core cities. Across the Bay Area residents are rising up and calling for change and our political leaders must act to build a stronger and more just region.

What can you do? Take action by supporting these local Black-led, grassroots community organizations that are working to end police violence and build community safety and justice in our region:

A Profile of Frontline Workers in Santa Clara County

Our analysis of the demographics of the essential workforce in Santa Clara County reveals that the workers on the frontlines of the pandemic are disproportionately Latinx, Filipinx, Vietnamese, and women of color, and face economic vulnerabilities.

The coronavirus is disproportionately impacting populations, locally and nationally, including those who are low-income, Black and Latinx, and people with underlying health conditions. In Santa Clara County, Latinx residents account for 27 percent of the population but 38 percent of those who tested positive for the virus, according to county data. A recent study showed that early deaths from COVID-19 hit residents in four East San Jose zip codes, which are largely Latinx, particularly hard. One-third of early COVID-19 deaths in the county occurred in these four zip codes alone. These are the neighborhoods where residents grapple with high poverty and where local leaders have gone on record citing the lack of protective gear, health insurance, and inadequate health care for essential workers.   

Our analysis of the demographics of frontline workforce in Santa Clara County reveals that these workers are more likely to live in or near poverty, pay too much for housing, and lack health insurance. The data in this post draws from our Profile of Frontline Workers in the Bay Area, based on data from the 2014-2018 American Community Survey provided by the Center for Economic and Policy Research. You can access the data for Santa Clara County here.

There are 245,500 essential workers in Santa Clara County — one-quarter of all county workers — spread across 11 industries, largely in health care, manufacturing, construction, grocery, and childcare and social services.

Latinx workers account for nearly one quarter of the workforce in Santa Clara County (24 percent) but are overrepresented in frontline industries (36 percent). Latinx workers are heavily concentrated in agriculture (77 percent), building cleaning services and waste management (76 percent), construction (63 percent), and domestic work (58 percent). This trend was similar regionwide, but Latinx overrepresentation in these industries was higher in Santa Clara County.

Although not overrepresented in essential industries overall, Asian or Pacific Islander (API) and Black workers are concentrated in specific frontline industries in the county. API workers account for 37 of all workers in the county but are overrepresented in manufacturing (45 percent) and health care (44 percent). API workers regionwide are similarly concentrated in health care and manufacturing, as well as in the trucking, warehouse, and postal service industry. Black workers account for 3 percent of workers in the county but are concentrated in the public transit (7 percent) and trucking, warehouse, and postal service (6 percent) industries, which is similar to regional trends.

White workers are not concentrated in essential industries overall but in utilities specifically, an industry with higher median earnings and a higher share of college educated workers, compared with other essential industries. This mirrors regional trends.

Immigrants account for about half (48 percent) of the workforce in Santa Clara County and a comparable share of the essential workforce (49 percent). Within specific industries however, including building cleaning services and waste management (67 percent) and domestic work (67 percent), immigrants account for the majority of workers. This is also the case, but to a lesser degree, in the agricultural (55 percent) and construction (55 percent) industries. At the regional level, immigrants account for well below half (37 percent) of the workforce and are concentrated in these and several other essential industries.

Women of color in the county account for a larger share of the essential workforce (37 percent) than the workforce overall (30 percent). This was also the case for the region overall. Specifically, Asian or Pacific Islander women account for 16 percent of all Santa Clara County workers but 31 percent of health-care workers, 26 percent of childcare and social services workers, and 21 percent of workers in select manufacturing industries. Latina workers account for 11 percent of the county’s workforce, but 43 percent of building cleaning and waste management workers, 27 percent of childcare and social services workers, 24 percent of agricultural workers, and 20 percent of workers in the grocery industry. Black or African American women account for only 1 percent of the workforce in Santa Clara County, but triple the share in the childcare and social services (3 percent) and health care (3 percent) industries. 

“I am in greater demand, spread thin, stressed out. I have been working, as an essential worker. My young adult children have not and require financial assistance.” 

– Nurse, Los Gatos, Santa Clara County


Latino men, who account for 14 percent of the county’s workforce are also heavily concentrated in frontline industries: 62 percent of construction workers, 52 percent of agricultural workers, 37 percent of trucking, warehouse, and postal service workers, 33 percent of building cleaning services and waste management workers, and 22 percent of workers in the grocery industry. These county trends reflect trends at the regional level. 

As a group, Asian workers in Santa Clara County are underrepresented in frontline industries. This is the case regionally, although to a lesser degree. Within the county’s Asian population, Vietnamese and Filipinx workers are overrepresented in most essential industries. Similar trends exist Bay Area wide for Filipinx workers but not Vietnamese workers. Santa Clara County Vietnamese workers account for 18 percent of Asian workers in the county but are overrepresented among these workers in several essential industries: construction (38 percent); childcare and social services (29 percent); trucking, warehouse, and postal service (26 percent); utilities (26 percent); manufacturing (25 percent); grocery (24 percent); and others. Santa Clara County Filipinx workers account for 15 percent of Asian workers in the county but are overrepresented among Asian workers in nearly every industry except for construction (12 percent). This was generally the case for Filipinx workers regionwide as well.

Chinese workers account for 26 percent of all Asian workers in the county but are underrepresented among Asian workers in essential industries overall. Chinese workers are heavily concentrated among Asian agricultural workers (42 percent), however. At the regional level, Chinese workers are more likely to be concentrated in construction than agriculture. Korean workers are 4 percent of Asian workers in Santa Clara County but are underrepresented among Asian workers in essential industries. Korean workers account for 9 percent of Asian workers in construction, a higher share than regionwide.

Indian workers account for over one-quarter of the Asian workforce in Santa Clara County, but are generally not overrepresented in essential industries (and therefore not included in the chart above).

Santa Clara County essential workers are more economically and socially vulnerable than workers overall. They are more likely to lack college degrees, rent rather than own their home, pay more than they can afford in rent, and work part time. They are also more likely to care for a senior at home, live in or near poverty, and lack English proficiency, health insurance, and internet access. Sixteen percent of all frontline workers live below 200 percent of the poverty level (about $48,000 for a family of four) compared with 12 percent of all workers. Frontline workers also earn less: These workers have median earnings of $55,935 compared with $79,076 across all industries. These figures largely match regional trends. 

Essential workers are more likely to lack health insurance (8 percent) compared with workers overall (6 percent), but even more stark are the uninsured rates within frontline industries. Workers that are particularly vulnerable include those in the agricultural, construction, building cleaning services and waste management, and domestic work industries, where the uninsured rates are as high as 21 percent (agricultural industry). Regionwide, these same industries have the highest uninsured rates. 

For frontline workers to be healthy and economically secure they need proper protective gear and testing, paid sick leave and affordable health care, living wages, childcare and elder care, and secure housing. Santa Clara County is now offering free COVID-19 testing for all residents 18 years of age and older regardless of symptoms, which is a step in the right direction. South Bay representative Assemblymember Ash Kalra and state and local leaders have introduced two proposals to bolster workers’ rights and protect working families:

  • AB 3216 would provide emergency paid sick leave, expand access to family leave, and create a right of recall for workers laid off in industries impacted by COVID-19.
  • A partial income replacement program for undocumented workers who experienced COVID-19 job losses and were excluded from state and federal unemployment benefits. This proposal is supported by a state coalition of worker and immigrant rights organizations with the Safety Net for All coalition.

Learn more about actions that employers and state and local government should take to support frontline workers and provide for the common good.

Sonoma County Latinx Workers are Overrepresented in Frontline Positions


Our analysis of the demographics of the frontline workforce in Sonoma County reveals that Latinx workers are disproportionately concentrated in frontline occupations.

Last Tuesday, Sonoma County’s public health department released new data revealing that the county’s Latinx residents are four and half times more likely to contract the coronavirus than White residents. Latinx residents represent about 27 percent of the population but 59 percent of those who’ve tested positive for the virus, according to the county data. In response, the county has ramped up testing for Latinx residents and pledged to investigate the cause of the disparity. Local leaders cite several possible causes, including the higher share of Latinx workers in low-wage jobs which lack health insurance or workplace protections, and the prevalence of multiple family households because of high housing costs.

Our analysis of the demographics of the frontline workforce in Sonoma County reveals that Latinx workers are disproportionately concentrated in frontline occupations where workers are more likely to live in or near poverty, lack US citizenship and health insurance, and have limited English proficiency. While Latinx workers are 26 percent of all workers, they are 33 percent of essential workers. The data in this post draws from our Profile of Frontline Workers in the Bay Area, based on data from the 2014-2018 American Community Survey provided by the Center for Economic and Policy Research. You can access the data for Sonoma County here.

There are 86,700 essential workers in Sonoma County — 34 percent of all county workers — spread across 11 industries, largely in health care, construction, manufacturing, and the grocery industry.

Latinx workers are overrepresented in the following frontline industries: agriculture (64 percent), building cleaning services and waste management (59 percent), domestic work (41 percent), construction (38 percent), and manufacturing (35 percent).

Latinx workers in Sonoma County account for the majority of workers in agriculture as well as building cleaning services and waste management. Although these industries are relatively small, compared with workers across all industries, these workers are more likely to rent rather than own their home, live in or near poverty, lack US citizenship and health insurance, have limited English proficiency, lack a high school diploma, care for children at home, and lack internet access.

Men of color are most likely to be concentrated in essential industries (24 percent share of essential industries versus 20 percent share of industries overall). Women of color are also slightly more likely to work in essential industries (18 percent share in essential industries versus 16 percent of industries overall). Men of color are concentrated in the following essential industries: agriculture (53 percent), construction (42 percent), trucking, warehouse, and postal service (37 percent), and building cleaning services and waste management (30 percent), among others. Women of color disproportionately work in the following essential industries: domestic work (50 percent), childcare and social services (33 percent), building cleaning services and waste management (31 percent), and health care (27 percent).

Latino men only make up 15 percent of Sonoma County workers but are the majority of workers in the county’s agricultural industry (52 percent), and a disproportionate share of construction workers (38 percent) and workers in the building cleaning services and waste management industries (29 percent). Latino men also account for about one quarter of workers in the trucking, warehouse, and postal service industry (25 percent) and manufacturing industry (24 percent).

Latina workers in Sonoma County account for about one out of every 10 workers (11 percent), but 4 in 10 domestic workers, 3 in 10 workers in building cleaning services and waste management (31 percent), and one-quarter of workers in childcare and social services.

For frontline workers to be healthy and economically secure they need proper protective gear and testing, paid sick leave and affordable health care, living wages, childcare and elder care, and secure housing. Learn more about actions that employers and state and local government should take to support frontline workers and provide for the common good.

A Profile of Frontline Workers in the Bay Area

Our analysis of the Bay Area's essential workforce reveals how the workers on the frontlines of the pandemic are disproportionately low-income, Latinx, Black, Filipinx, women of color, and immigrants and face economic and social vulnerabilities.

By Jamila Henderson, Eliza McCullough, and Sarah Treuhaft

The COVID-19 crisis is shining a spotlight on inequities throughout our society and economy, including the divide between knowledge economy workers who can safely shelter in place and work-from-home and frontline “essential” workers, predominantly people of color, whose work interacting with the public puts them at greater risk of contracting the virus. This divide is particularly gaping in the Bay Area, with our stark inequality and tech-driven economy. Grocery store clerks, bus drivers, janitors, and other frontline workers perform work that we depend on for our daily lives, yet they often are paid low wages, lack sick days and health insurance, and lack full workers’ rights. On May 1, workers at Instacart, Whole Foods, McDonalds, and other companies went on strike demanding proper protective equipment and fair wages.

A new study based on extensive community testing in the Mission District, which has the most coronavirus cases among all San Francisco neighborhoods, provides data underscoring the very real risks faced by essential workers: 90 percent of residents who tested positive for the virus cannot work from home, 95 percent are Latinx, and 82 percent said they have been financially affected by the pandemic. Early data from Santa Clara County also shows that Latinx and Black residents are dying from the virus at higher rates than other groups. The virus is exploiting and deepening existing inequities by race, class, and geography that were produced through explicitly and implicitly racist policies and business practices – ultimately exacerbating regional inequality.

Knowing who is vulnerable is crucial for developing solutions. This analysis, based on data from the 2014-2018 American Community Survey provided by the Center for Economic and Policy Research, describes the characteristics of essential workers in the nine-county Bay Area and describes actions that employers and policymakers can take to ensure their health and economic security. Find our full methodology below and download the data tables for the analysis – including data for each of the nine Bay Area counties – here. Read our county level analyses, including our posts for Sonoma County and Santa Clara County, and stay tuned for future Bay Area county analyses.

There are 1.1 million essential workers in the region — about 28 percent of all workers — spread across 11 industries. These workers include doctors and nurses on the frontlines of the health crisis as well as the workers taking care of their children. They also include the farm and factory workers who produce our food and other household goods, and the cashiers, postal workers, and warehouse workers who ensure we can get them. Other essential workers are the janitors, housekeepers, and waste management workers that keep our facilities, residences, and communities clean, and the bus drivers that allow other essential workers to reach their jobs.

Workers of color are overrepresented in frontline industries overall, representing 58 percent of all workers but 66 percent of essential workers. Latinx workers represent 22 percent of workers in all industries but 31 percent of frontline workers. Latinx workers are particularly overrepresented in building cleaning/waste management and agriculture, accounting for about two-thirds of workers in each industry. Latinx workers are similarly overrepresented among domestic workers and construction occupations, accounting for half of all workers in these industries.

Black workers, who account for just 5 percent of all workers in the region, are also concentrated in specific frontline industries including public transit (23 percent); trucking, warehouse, and postal services (11 percent); childcare and social services (10 percent); and health care (8 percent).

Although not overrepresented among frontline industries as a whole, Asian and Pacific Islander (API) workers, who account for more than a quarter (27 percent) of workers overall, are overrepresented in frontline industries including health care (36 percent); manufacturing (32 percent); and trucking, warehouse, and postal service industries (32 percent). Immigrant workers also make up a disproportionate share of essential workers (43 percent) compared with 37 percent across all industries.

Women of color are most likely to be concentrated in essential industries (33 percent share of essential industries versus 27 percent share of industries overall). Men of color are also slightly more likely to work in essential industries (33 percent share in essential industries versus 31 percent of industries overall). Women of color disproportionately work in the following essential industries: domestic work (66 percent); childcare (54 percent); health care (47 percent); and building cleaning services/waste management (42 percent). Latina workers make up one- tenth of the labor force, but nearly half of all domestic workers (47 percent), 37 percent of building cleaning services/waste management workers, and 23 percent of childcare and social services workers. API women account for 13 percent of the labor force, but one-quarter of workers in the health-care industry and about one-fifth in the childcare and social services industry (21 percent). Black women, who make up 3 percent of all workers, are overrepresented in the public transit (11 percent), childcare and social services (8 percent), and health care (6 percent) industries. Among male workers, Latinos, who make up 13 percent of all workers, are overrepresented in essential industries of construction (52 percent); agriculture (49 percent); building cleaning services/waste management (30 percent); and trucking, warehouse, and postal service (26 percent).

Chinese workers make up the largest share of Asian workers (33 percent), and although they are not overrepresented across all frontline industries, they account for over half (53 percent) of Asian workers in construction and are also overrepresented in utilities, childcare and social services, agriculture, and building cleaning/waste management. Filipinx workers account for 22 percent of all Asian workers, 35 percent of all Asian workers in frontline industries, and 47 percent of Asian health-care workers. Many Filipinx nurses trained in American nursing programs in the Philippines, a relic of US colonial rule in the country, and filled a growing need for nurses in the United States following WWII.

Other Asian workers are not overrepresented in frontline industries overall, but are concentrated within specific industries. Vietnamese workers, for example, make up one-tenth of all Asian workers yet 15 percent of Asian construction workers and 13 percent of Asian manufacturing workers. Japanese workers account for 4 percent of all Asian workers, but 15 percent of Asian workers in the agricultural industry. Indian workers make up one-fifth of all Asian workers but are not concentrated in frontline industries (and therefore are not included in the chart above).

Frontline workers have more economic and social vulnerabilities than workers overall. They are more likely to live in poverty, rent rather than own their homes, pay too much for housing, have limited English, lack US citizenship, be caring for children and/or seniors at home, and lack internet access. Nearly 17 percent of all frontline workers live below 200 percent of the poverty level (about $48,000 for a family of four) compared to 13 percent of all workers. Frontline workers earn less (median earnings of $57,989 versus $70,917 for all industries) and are less likely to hold a college degree, and more likely to lack health insurance.

Frontline workers are more likely to lack health insurance (8 percent) compared with workers overall (6 percent), but even more stark are the uninsured rates within particular frontline industries. Workers that are particularly vulnerable include those in the agriculture; domestic worker; construction; and building cleaning services/waste management industries, where the uninsured rates surpass 15 percent. Frontline industry workers face other challenges that also put their health at risk, including a lack of sick days and the inability to advocate for their rights as workers without retribution.

Frontline Workers Need Our Support

Essential workers put their health on the line every shift to provide for our community’s basic needs — and we must do everything possible to minimize their health risks and ensure their financial stability and long-term success. For frontline workers to be healthy and economically secure they need proper protective gear and testing, paid sick leave and affordable health care, living wages, childcare and elder care, and secure housing.

Employers and the federal government should be doing much more to provide these essentials, but given insufficient action, Bay Area cities have implemented multiple policies to improve conditions, including free coronavirus testing sites, free and reduced-price childcare, and expanded mental health services. While these policies provide a good starting point, we must dramatically expand protections for frontline workers at the municipal, state, and federal level to ensure that they are healthy and safe throughout the duration of this crisis and beyond.

Employers and state and local government should take the following actions to support frontline workers and provide for the common good.

Employers must ensure safe working conditions, paid sick leave, living wages, and a voice at work. Employers should take all possible steps to prevent employee exposure to COVID-19, including provision of masks and gloves, frequent hand-washing breaks, and routine surface cleaning. Employers should also offer paid sick leave for all workers, including contractors. (Businesses with more than 500 employees are not required to provide paid sick leave under the federal Emergency Paid Sick Leave Act.) Small and mid-sized businesses must allow employees to stay home if exposed to COVID-19 or if they or a loved one is sick. Employers should provide hazard pay to account for the danger involved in working during this pandemic, and should be paying frontline workers a living wage at all times. The Insight Center’s Family Budget Calculator shows that in Alameda county, a family of four with an infant and a child in elementary school needs about $105,000 to cover basic household expenses: a $24.74 hourly wage for both working parents. Lastly, workers should be able to voice their concerns about working conditions and negotiate for better pay, benefits, and conditions without retribution.

Local governments should expand paid sick leave, increase access to free testing and affordable treatment, and cancel rent, mortgage, and utility payments. First, they should require paid sick leave for employers of all sizes. Berkeley, Emeryville, and San Francisco had paid sick leave policies prior to the outbreak, and San Jose passed an emergency paid leave ordinance covering large employers and gig workers that are not covered by the federal Emergency Paid Sick Leave Act, including gig workers in early April. San Francisco extended its ordinance to allow employees to care for sick relatives and cover gig workers. Oakland City Councilwoman Sheng Thao has also called for an expanded emergency paid sick leave ordinance. Local governments should also provide free testing and ensure access to affordable treatment for those infected with COVID-19. Finally, local governments should ensure everyone, including frontline workers, has access to safe housing. Although more than a dozen Bay Area cities have passed emergency tenant protections, such as suspending evictions and late fees for those affected by COVID-19, and several San Francisco supervisors have proposed rent cancellation, no jurisdiction has canceled rent, mortgage, or utilities payments. The San Francisco Board of Supervisors also recently announced that the city will secure 8,250 hotel rooms for frontline workers, those experiencing homelessness, and other vulnerable groups. Bay Area cities should replicate and expand upon these actions to ensure everyone has housing.

The state has a key role to play in protecting workers in the Bay Area and beyond by expanding access to paid sick leave, testing and treatment, and housing; and suspending rent and mortgage payments for workers impacted by COVID-19. First, California must expand access to Medi-Cal as multiple news reports have found that coronavirus testing and treatment can cost as much as $35,000 for uninsured patients. In March, the state waived all cost-sharing for COVID-19 testing and facilitated Medi-Cal enrollment for those seeking testing and treatment. California should allow all undocumented residents to access comprehensive Medi-Cal coverage. Next, the governor should expand Executive Order N-51-20, which requires food sector employers with 500 or more employees to provide paid sick leave, to cover employers of all sizes and include other frontline industries such as transportation. California must also strengthen tenant protection policies and fund housing initiatives to ensure all frontline workers have a home. While the state enacted a statewide moratorium on evicting renters impacted by COVID-19, rent and mortgage payments should also be suspended. Governor Newsom recently announced a program that will provide frontline health-care workers with hotel rooms close to hospitals. This program should be expanded to provide housing for all frontline workers who need housing. Finally, California should enact the Essential Workers’ Bill of Rights put forward by the California Labor Federation, which includes demands such as protecting and expanding the right to form a union and ending ICE raids, deportations, and other attacks against our immigrant communities.

Methodology

The data for this analysis was provided by the Center for Economic and Policy Research (CEPR) which produced an analysis of frontline workers at the national and state level. We use a similar methodology described below.

This analysis of frontline workers (16 years and older) in the Bay Area includes 11 frontline industry categories, but no workers in frontline occupations that are outside of these 11 categories. As a result, estimates exclude some workers in occupations (but not industries) that are clearly on the frontlines, while also including some workers who are not in frontline occupations, even though they are in frontline industries. For example, a police officer is a frontline occupation, but this occupation does not fall within the 11 frontline industries.  A school bus driver on the other hand, is not a frontline occupation given school closures, but it falls within a frontline industry (public transit). Still, most workers in the 11 frontline industry categories are frontline workers.

The Bay Area analysis includes the six industries included in CEPR’s analysis (health care; grocery, convenience, and drug stores; childcare and social services; building cleaning services; trucking, warehouse, and postal service; and public transit) plus the following industries prioritized by our Equity Campaign Leaders Advisory Committee and the Equity Working Group of ReWork the Bay: waste management; agriculture, forestry and fishing; select manufacturing sub industries; utilities; domestic workers (excluding health care); and occupations within the construction industry. The specific industries or occupations within each industry group include:

  1. Health Care: Offices of physicians; outpatient care centers; home health-care services; other health-care services; general medical and surgical hospitals, and specialty (except psychiatric and substance abuse) hospitals; psychiatric and substance abuse hospitals; nursing care facilities (skilled nursing facilities); residential care facilities, except skilled nursing facilities.
  2. Construction: Occupations within the construction industry, including construction trades (e.g., electricians, painters) and laborers.
  3. Manufacturing: Food and agricultural manufacturing; medical supply manufacturing; other critical manufacturing (e.g., commercial and service industry machinery).
  4. Grocery, Convenience, and Drug Stores: Grocery and related product merchant wholesalers; supermarkets and other grocery stores; convenience stores; pharmacies and drug stores; and general merchandise stores, including warehouse clubs and supercenters.
  5. Childcare and Social Services: Individual and family services; community food and housing, and emergency services; and child day care services.
  6. Building Cleaning Services and Waste Management: Cleaning services to buildings and dwellings (except for construction); and waste management and remediation services.
  7. Trucking, Warehouse, and Postal Service: Truck transportation; warehousing and storage; and postal service.
  8. Domestic Workers (not including health care): Private households.
  9. Agriculture, Forestry, and Fishing: Crop production; animal production and aquaculture; forestry except logging; logging; fishing, hunting and trapping; support activities for agriculture and forestry.
  10. Utilities: Electric power generation, transmission, and distribution; natural gas distribution; electric and gas, and other combinations; water, steam, air conditioning, and irrigation systems; sewage treatment facilities; not specified utilities.
  11. Public Transit: Rail transportation; and bus service and urban transit.

Racial/ethnic categories include Hispanic/Latino of any race; the following non-Hispanic, single race categories: White; Black/African American; and Asian American or Pacific Islander. The “Other” category includes populations too small to report individually (i.e., Native American or Alaska Native; two or more races; and those who identify as another single race not included above). Because the Asian American and Pacific Islander population in the Bay Area is very diverse, we include disaggregated data for the largest Asian American and Pacific Islander  ancestries in the Bay Area (which are all “Asian” ancestries; Pacific Islanders, a small share, are excluded from the disaggregated Asian ancestry analysis).

Bay Area's Latinx Population Remains Highly Underrepresented in Local Politics

Despite the election of 10 Latinas in Bay Area cities in 2018 and 2019, Latinx residents remain largely underrepresented in local politics.

With many businesses across the Bay Area forced to shutter due to the coronavirus pandemic, we are reminded of how disasters and public health emergencies, rather than impacting everyone equally, exacerbate preexisting inequities. San Francisco reports that Latinx residents make up 24 percent of confirmed COVID-19 cases but are only 15 percent of the county’s population. The health and economic inequities experienced by Latinx people in the region are matched by political exclusion. Latinx people represent one of the Bay Area’s fastest-growing racial/ethnic groups but remain severely underrepresented in local elected offices, according to our recent analysis of new data on the diversity of elected officials from 2018 and 2019.

Latinx people make up 24 percent of residents in the nine-county Bay Area — including 33 percent of Napa County— but just 10 percent of top local elected officials identify as Latinx. With 170 seats up for grabs in the 2018 and 2019 elections, the total number of Latinx local electeds in the region increased by 10— and all were Latinas. Despite this slight uptick, it was not enough to considerably improve Latinx political representation.

Some Bay Area cities, however, did improve on the representativeness of their top electeds, while others fell behind. This post shares key findings from our analysis of how the region’s 101 cities are doing on this measure, which is calculated based on difference between the share of Latinxs among top elected officials and the share of Latinxs in the total population. Note that the city electeds include both city council and county elected officials (supervisors and DAs) because county electeds also represent city residents. This means that the typical city/town has 11 electeds included in the analysis (five council members, five county supervisors, and one county district attorney).

Little Improvement Among the Cities with the Greatest Latinx Underrepresentation

The cities with the starkest Latinx underrepresentation are largely the same as they were two years ago, with a few exceptions. East Palo Alto, Colma, Oakley, and South San Francisco saw no changes and remain among the top five most underrepresented cities for Latinxs. East Palo Alto, where Latinx people make up 63 percent of the population, remains number one as just 18 percent of local elected officials identify as Latinx. The city of Colma, which is 45 percent Latinx, moved into number two as just one local elected identifies as Latinx. People who are Latinx similarly make up 35 percent of Oakley but lack any Latinx representation at the city or county level. In South San Francisco, 34 percent of the population is Latinx but there are no top elected Latinx officials.

Importantly, three cities among the top 20 with the least Latinx political representation — San Pablo, Cloverdale, and Gilroy — elected at least one Latinx local elected official and improved their Latinx representation. The city of Richmond, on the other hand jumped from number 16 to the fourth most underrepresented city for Latinx people as discussed in more detail below.

Bay Area Latinx Electeds Change in Rankings


San Pablo and Cloverdale See Biggest Gains Followed by Gilroy

San Pablo dropped out of the top 3 most underrepresented cities with the election of vice-mayor Elizabeth Pabon-Alvarado, who unseated a sixteen-year incumbent. But the city still ranks eighth in underrepresentation, however, as Latinxs make up 61 percent of the city’s population but are just 27 percent of local electeds.

In the North Bay, the city of Cloverdale also dropped out of the top 10 cities where Latinos were most underrepresented down to number 19 as the city, which is 31 percent Latino, elected a Latina to the city council in 2018. In fact, Council Member Marta Cruz cited the fact that Cloverdale had no Latinx representation on the city council or school board as a reason for her running.

In 2019, Gilroy became the Bay Area city with the second-highest number of local elected Latinx officials with five Latinx representatives (after San Jose which has 6 and is well represented). Yet Gilroy remained in the rankings of the top 20 most underrepresented cities for Latinxs because those five representatives make up just 38 percent of all top local elected officials in a city that is 61 percent Latinx.

Richmond was One of Four Cities in the Region that Lost a Latinx Elected Official

Richmond jumped to the fourth most underrepresented for Latinx people as one young Latina council member did not win reelection leaving just one Latinx elected official on the seven-person council in 2019. Latinxs make up 42 percent of the city’s population but are now only 8 percent of city and county elected officials.

Only three other cities lost a Latinx local elected official from 2018 to 2020: Oakland, San Francisco, and Alameda. Among these cities, only Oakland retains at least one Latinx councilmember. Both San Francisco and the city of Alameda lack any Latinx representatives at the city or county level.

47 Cities in the Region Lack Any Latinx Representation 

The cities bolded in the chart above are notable because they do not have any Latinx elected officials at the municipal or county level despite having relatively large Latinx populations. Oakley, South San Francisco, Healdsburg, and Antioch are all 33 percent to 35 percent Latinx but lack Latinx representation entirely. Similarly, the cities of Concord and San Rafael, both roughly 30 percent Latinx, also lack any Latinx representation.

A Clear Need for Action

While representation does not ensure the passage of more equitable policies, it matters for political power. Local officials hold considerable power over the everyday lives of Bay Area residents, and they ought to reflect the diversity of the communities they serve. Improving on this indicator involves directly addressing the multiple barriers that hold Latinx residents back from running for political office whether they are economic, linguistic, institutional, or historic.

Even before the coronavirus epidemic, working-class people in the region were struggling to make rent, find affordable childcare, and secure living-wage jobs. The historic spike in layoffs and unemployment brought about by COVID-19 has only heightened economic insecurity. Many families are struggling to make ends meet and are focused on finding work and paying bills rather than increasing political involvement.

But political inclusion is a critical part of building a more equitable region and we, along with our partners at Bay Rising, lift up the following recommendations to move us toward just and fair inclusion into a region where all can participate and prosper:

  • Local governments (cities, towns, and counties) should pass structural reforms including public campaign financing, like Berkeley’s program that provides candidates a 6-to-1 match on qualifying contributions of up to $50, and campaign finance reform to curtail corporate contributions, secret Super PACs, and “pay-to-play” politics.
  • Local and national philanthropies and corporations should fund equity-oriented leadership development programs, like Urban Habitat’s Boards and Commissions Leadership Institute, that prepare people from underrepresented communities of color to effectively engage in public policy.
  • Policymakers and funders should support voting reforms and civic engagement efforts that increase voter registration and turnout among underrepresented communities, especially in local elections.

Bay Area Asian Population Strong in Numbers, Vastly Underrepresented in Politics

Diversity of electeds data shows Asian and Pacific Islanders are 26% of Bay Area residents, but just 10% of local electeds.

The spike in discrimination and harassment toward Asian Americans amid the coronavirus pandemic is a painful reminder of continued racism and xenophobia in our region. Although Asian Americans, as a broad group, perform well on many indicators of socioeconomic success, other indicators signal continued exclusion and inequity, such as the diversity of local electeds, a unique dataset maintained by the Bay Area Equity Atlas.

Asian or Pacific Islanders (APIs) remain vastly underrepresented in the highest echelons of local politics, according to our recent analysis of new data on the diversity of elected officials from 2018 and 2019. While APIs make up 26 percent of residents in the nine-county Bay Area — and are the single largest racial/ethnic group in Santa Clara and Alameda counties — they hold just 10 percent of top local elected positions. At the regional level, this unequal representation has not improved over the past two years: 170 seats were up for grabs in Bay Area cities and counties in the 2018 and 2019 elections, but the overall share of API electeds did not change.

Beneath the regional level, however, some Bay Area cities did improve on the representativeness of their top electeds, while others fell behind. This post shares key findings from our analysis of how the region’s 101 cities are doing on this measure, which is calculated based on difference between the share of APIs among top elected officials and the share of APIs in the total population. Note that the city electeds include both city council and county elected officials (supervisors and DAs) because county electeds also represent city residents. This means that the typical city/town has 11 electeds included in the analysis (five council members, five county supervisors, and one county district attorney).

Little Improvement Among the Worst Performing Cities

The cities with the starkest API underrepresentation are largely the same as they were two years ago, with a few exceptions. The top three most underrepresented cities in 2018 — Foster City, San Ramon, and Santa Clara — each gained one API elected official, but they remain continue to lag on API representation because their populations are between 42 to 48 percent API.

Five cities in the top 20 most underrepresented cities for APIs actually lost an API elected, worsening their performance. Among these cities, and now the least representative of APIs, are Milpitas and Cupertino.

Bay Area API Electeds Change in Rankings


Among the cities with the least API representation, Fremont Sees Biggest Gains in API Electeds, followed by Foster City, San Ramon, and Santa Clara

Four of the least representative cities in 2018 elected at least one API and saw their rankings improve. Fremont dropped most significantly from the ninth most underrepresented city down to number 27. In 2018, the Fremont City Council expanded from five to seven members and had their first ever district elections. The number of API city council members doubled from two to four, including two men and two women. Fremont now has the most API council members of any Bay Area city and is evenly represented as the total population is 58 percent API.

Foster City, San Ramon, and Santa Clara each elected one API representative and dropped from the top three to numbers five, eight, and nine, respectively. In the South Bay, Foster City, which is 48 percent API, elected Sanjay Gehani and the city of Santa Clara, which is 42 percent API, elected Raj Chahal. Across the Bay in San Ramon, where 45 percent of residents are API, voters elected Sabina Zafar.

Hercules Loses the Most Ground, Followed by San Jose and Hayward

Milpitas and Cupertino, where two in three residents are API, have the largest share of API residents of any of the 101 cities in the Bay Area, but just 18 percent of local electeds (city and county) are API. Both cities are now represented by just two API elected officials. In 2018, one API councilmember in Milpitas lost his 2018 reelection bid to two Latinas. And in Cupertino, one South Asian councilwoman lost her 2018 reelection bid to a White man by just 45 votes.

The city of Hercules, where half of the population is API, rose up eight places in the rankings to the fourth most underrepresented city for APIs in the Bay Area in 2020. Hercules Mayor Roland Esquivias, who is up for reelection later this year, is now the only API elected official in the city as the Contra Costa County Board of Supervisors lacks any API representation. In San Jose, District 7 Council Member Tam Nguyen lost his reelection bid in 2018, with early reports at the time saying just 13 votes separated him from current Council Member Maya Esparza.

57 Bay Area Cities Have No API Representation

The cities bolded in the chart above are notable because they do not have any API elected officials at the city or county level despite having relatively large API populations. American Canyon, located in Napa County, is 36 percent API but does not have any API local elected officials. San Bruno similarly lacks API representation but is 30 percent API. Three of the cities on the list of the top 20 most underrepresented cities for APIs — Brisbane, Burlingame, and San Mateo — are all located in San Mateo County. Roughly one in four residents in each of these cities are API, but they lack representation at both the city and county level.

A Clear Need for Action

While representation does not ensure the passage of more equitable policies, it matters for political power. Local officials hold considerable power over the everyday lives of Bay Area residents, and they ought to reflect the diversity of the communities they serve. Improving on this indicator involves directly addressing the multiple barriers that hold API residents back from running for political office whether they are economic, linguistic, institutional, or historic.

Even before the coronavirus epidemic, working-class people in the region were struggling to make rent, find affordable childcare, and secure living-wage jobs. The historic spike in layoffs and unemployment brought about by COVID-19 has only exacerbated economic insecurity. Many families are struggling to make ends meet and are focused on finding work and paying bills rather than increasing political involvement.

But political inclusion is a critical part of building a more equitable region and we, along with our partners at Bay Rising, lift up the following recommendations to move us toward just and fair inclusion into a region where all can participate and prosper:

  • Local governments (cities, towns, and counties) should pass structural reforms including public campaign financing, like Berkeley’s program that provides candidates a 6-to-1 match on qualifying contributions of up to $50, and campaign finance reform to curtail corporate contributions, secret Super PACs, and “pay-to-play” politics.
  • Local and national philanthropies and corporations should fund equity-oriented leadership development programs, like Urban Habitat’s Boards and Commissions Leadership Institute, that prepare people from underrepresented communities of color to effectively engage in public policy.
  • Policymakers and funders should support voting reforms and civic engagement efforts that increase voter registration and turnout among underrepresented communities, especially in local elections.

Despite Progress Since 2018, Bay Area Diversity Not Reflected Among Top Local Electeds

By Ángel Mendiola Ross, Sarah Treuhaft, Michelle Huang, Justin Scoggins, and Kimi Lee of Bay Rising*


With so much attention focused on the 2020 presidential elections, it is easy to forget the importance of local elections to the everyday lives of Bay Area residents. Local governments are the closest and most responsive to the people. They also make critical decisions around issues like housing, policing, and transportation that can have significant equity implications – for example, the racist and unconstitutional “stop and frisk” policing policies of the recent past.

Given the power instilled in local electeds, it is crucial that these leaders reflect the diversity of the communities they represent. Although race or gender do not alone determine whether an elected official will advance racial or gender justice, and having more people of color and women in office does not automatically translate to more equitable policies – representation matters. Leaders who come from communities that experience discrimination and structural racism firsthand bring that knowledge into governing and can be important advocates for policies that dismantle barriers and improve conditions. And when marginalized communities gain representation in the halls of power, they can feel less neglected, gain trust in government, and have a stronger sense of belonging.

This is why the Bay Area Equity Atlas includes the diversity of electeds as a key metric for tracking equity in the region. To examine how well the Bay Area’s top elected officials represent the diversity of the region’s population, we assembled a unique dataset on the race,  ethnicity, and gender of the mayors and council members of the region’s 101 municipalities, and the county supervisors and district attorneys for the region’s nine counties.(1) Our dataset captures the composition of elected officials at three points in time to cover the results of 2017-2019 elections.

This analysis presents new data from two election cycles: November 2018, when 160 local elected positions were up for grabs, and November 2019, when 10 positions were open. The longitudinal data allows us to update previous data from May 2018 to examine whether we are making progress on this important indicator.

Our key findings include:

  • While the region is 60 percent people of color, whites hold 71 percent of local elected offices.
     
  • There are dozens of cities without any Black, Latinx, or Asian and Pacific Islander (API) representatives at all: among the 101 municipalities within the Bay Area region, 80 have zero Black elected officials, 42 have zero Latinx or API elected officials, and 33 have all White elected officials.
     
  • The share of women holding office in top municipal and county level positions is now 44 percent — up from 40 percent in May 2018; however among Latinx electeds only 40 percent are women.
     
  • APIs and Latinx people continue to be sorely underrepresented among local electeds, especially at the county level. Latinx and APIs make up half of the region’s population but are just 13 percent of top county-level elected officials. Most strikingly, Santa Clara County has the largest share of API residents of all the nine counties that make up the Bay Area (35 percent), but there are no API electeds in top county positions. Similarly, in Sonoma County, which is 26 percent Latinx, there are no Latinx in top county elected positions.
     
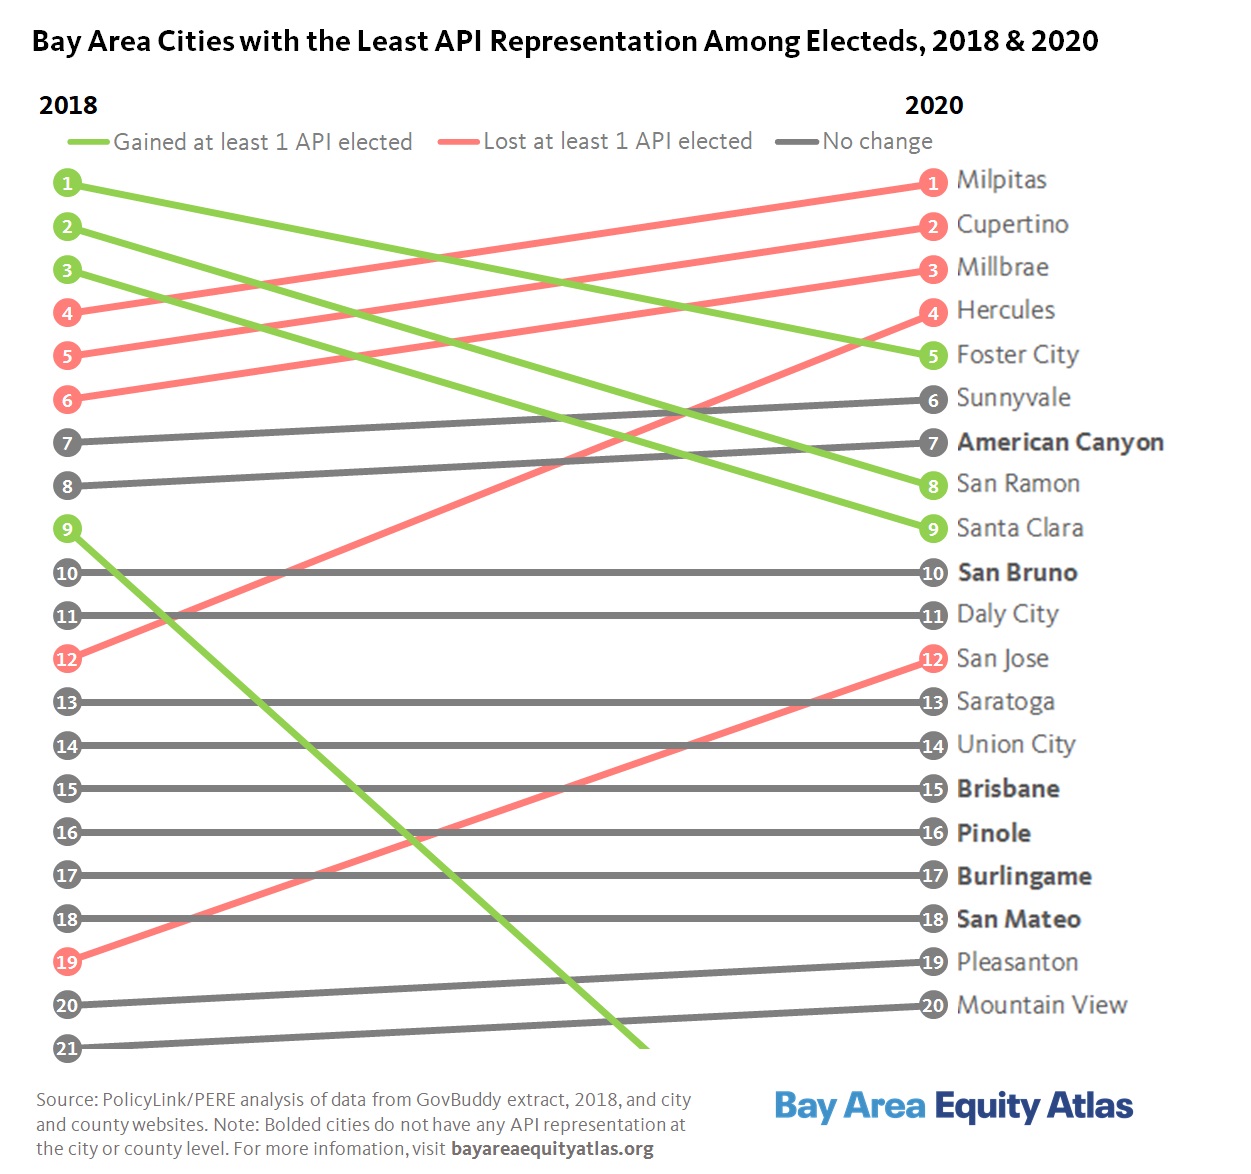
  • The most substantial changes in representation since the 2018 elections were at the city level, including several shifts in the rankings of the cities with the largest White overrepresentation and Latinx, API, and Black underrepresentation. Five cities that were formerly represented by all-White city councils elected at least one person of color in 2018: Benicia, Brisbane, Cloverdale, San Ramon, and Santa Clara.

Despite notable wins for candidates of color in the last couple years, the region continues to underperform on this equity metric. Campaign finance and election reforms and investments in programs that support people of color in running for elected office as well as increased voter engagement efforts are all needed to ensure that the region’s diversity is truly reflected in local elected offices.

Regionwide, Whites Remain Overrepresented with Some Progress After 2018 Elections

In early 2018, 74 percent of elected officials were White. But by 2020, the share of White elected officials in the region decreased to 71 percent. Whites are still overrepresented among local elected officials as just 40 percent of the region’s population is White, but the 2018 and 2019 elections made some progress toward reducing this overrepresentation. The slight uptick among people of color was due to increases in Latinx, Black, and multiracial elected officials.

Despite comprising 26 percent of the region’s population, only 10 percent of local elected officials identify as API. Similarly, 24 percent of residents are Latinx, but only 10 percent of local elected officials. As of early 2020, there is still not a single top city or county elected official in the Bay Area who identifies only as Native American. Across the region, there are 65 cities that do not have a single Latinx councilmember and 63 cities without any API representation.

Number of Women in Local Elected Office Increased by 31, But White Men Still Overrepresented

Reports of a record-breaking number of women running for office in 2018 led many to dub it the “Year of the Woman.” White men are particularly overrepresented among local elected officials, but there were significant changes in gender disparities after the November 2018 elections. In the Bay Area, the number of women in top local elected positions increased by 31 from 236 to 267. In early 2018, 60 percent of White electeds were male. But that share declined to 56 percent after the 2018 elections.

But not all racial/ethnic groups saw progress toward greater gender representativeness. The most gender parity is among API electeds, 49 percent of whom are women. The gender disparity remains largest among the Latinx population: just 40 percent of the region’s Latinx elected officials are women. And whereas Black elected officials were previously the only group of electeds in which women outnumbered men, that changed with the 2018 election. Before the election, 18 of the region’s 33 Black elected officials were women (55 percent). Today, just 17 of the region’s 39 Black elected officials are women (44 percent).

By 2020, four Bay Area cities were represented entirely by men: Woodside, Dixon, Corte Madera, and Richmond. The councils of Woodside and Corte Madera are the only ones made up entirely of White men. Los Altos, on the other hand, is the only city in the region represented by an all-female city council.

Underrepresentation of Asian and Latinx Residents Especially Pronounced at the County Level

Underrepresentation of API and Latinx residents is especially pronounced among county-level officials: just four of the region’s 60 county-level officials are API and four are Latinx. Put another way, Latinxs and APIs together make up half of the region’s population but are only 13 percent of top county-level elected officials. Among the region’s nine district attorneys (DAs), all except for one are White, and none are API or Latinx.

Most strikingly, Santa Clara County, which has the largest share of API residents among the nine Bay Area counties (35 percent of residents are API), has no API electeds in top county positions. Alameda County has one API supervisor (out of five) but 30 percent of the county’s population is API. The San Francisco Board of Supervisors has three API members, but APIs are still underrepresented as these three electeds make up just a quarter of top elected officials in a county that is 34 percent API.

Only Napa, Santa Clara, and Solano Counties have any Latinx supervisors. Latinxs in Napa County are most evenly represented: the county has two Latinx supervisors (making up 33 percent of top county elected officials) in a county that is 34 percent Latinx. Santa Clara and Solano counties each have one Latinx county supervisor (out of five) even though Latinxs make up just over a quarter of the population of both counties. In Sonoma County, which is also a quarter Latinx, there are no Latinxs in top county elected positions.

Whites, on the other hand, are severely overrepresented in county-level elected positions. In three counties (San Mateo, Sonoma, and Marin), the entire Board of Supervisors (plus the DA) are White even though White people make up 40 percent of San Mateo County, 64 percent of Sonoma County, and 71 percent of Marin County. In Santa Clara and Solano counties, where more than 60 percent of the population are people of color, all but one of the top county officials are White. The only non-White DA in the whole region is Diana Becton in Contra Costa County.

Despite Notable Victories for Candidates of Color, Whites Still Overrepresented in City Councils

The most substantial changes in political representation were at the city level, including several shifts in the cities with the largest White overrepresentation and the greatest Latinx, API, and Black underrepresentation.

As of February 2020, 33 Bay Area cities are represented by all-White city councils — down from 36 before the 2018 elections. Five cities that were formerly represented by all-White city councils elected at least one person of color in 2018 or 2019: Benicia, Brisbane, Cloverdale, San Ramon, and Santa Clara. But three city councils turned all White, losing one elected of color: Moraga, Rohnert Park, and Larkspur. This means that, in a region of 7.8 million people, nearly 330,000 people of color live in cities or towns that lack elected officials of color to represent their interests. Most notably, Albany is one of those 33 cities even though its population is majority people of color. Campbell, Napa, Pacifica, Pleasanton, and Vacaville are also less than 55 percent White, but as of this year, are represented by all-White city councils.

The cities most overrepresented by White electeds are largely the same group of South Bay cities from before the 2018 elections. Notably, the cities of Santa Clara and Sunnyvale each elected one API council member in the 2018 election. Santa Clara elected a South Asian (immigrant) city council member (Raj Chahal in District 2) and Sunnyvale elected a Chinese American city council member (Mason Fong in Seat 3 who is believed to be the youngest person ever elected to the council at 27 years old), but Whites are still severely overrepresented on both councils (accounting for six out of seven members) in cities that are only 33 percent White. Across the Bay, the city of San Ramon also elected a woman of color to the council in 2018. The city is only 39 percent White, but four out of five city council members are White. Only three cities in the entire region (East Palo Alto, Milpitas, and Pittsburg) do not have any White representation on their city councils.

The city of Fremont made progress on increasing political representation for its API population. In 2018, the Fremont City Council expanded from five to seven members and had their first ever district elections. The number of API city council members doubled from two to four, including two men and two women. In fact, Fremont now has the most API council members of any Bay Area city and is evenly represented as APIs make up 58 percent of Fremont’s population.

As API representation among elected officials did not shift considerably regionwide, a few cities remain severely underrepresented. In Western Contra Costa, for example, the city of Hercules is nearly majority (48 percent) API but only the mayor is API. Similarly, the city of Pinole is 25 percent API but not a single city council member is API.

The North Bay city of Cloverdale improved its representativeness for its Latinx population, which is 31 percent of the total city population, by electing a Latinx to the city council in 2018. In fact, Council Member Marta Cruz cited the fact that Cloverdale had no Latinx representation on the city council or school board as a reason for her running.

In 2020, there were still six cities across four counties (Oakley, South San Francisco, Healdsburg, Antioch, Concord, and San Rafael) with populations between 30 to 35 percent Latinx without a single Latinx local elected official (at either the city or county level).

Of all 101 cities in the Bay Area, just 21 have at least one Black city council member or mayor (up from 19 cities before the 2018 elections). The Eastern Contra Costa County city of Pittsburg has more Black representation than any other Bay Area city. Four out of the five council members are Black, two of whom are Black women. Richmond also has four Black city council members (out of 7 overall), all of whom are Black men.

Richmond contrasts with the city of Vallejo. Both cities are 20 percent Black, but before 2018, there were no Black city councilors in Vallejo. During the 2018 election, Hakeem Brown received the most votes out of any of the five candidates in the race. But with just one Black member out of seven total seats, Black residents in Vallejo remain underrepresented.

Eighty cities and towns across the Bay Area do not have a single Black city council member, including Emeryville (which is 15 percent Black), San Pablo, and San Leandro. Notably, both San Pablo and San Leandro each lost a Black city council member after the 2018 elections.

Looking Forward: Toward A More Inclusive Bay Area Politics

Despite notable improvement since 2018, the Bay Area still lags behind when it comes to political representation – hindering the inclusive, multiracial, community-driven political coalition needed to solve our region’s challenges. As the Bay Area continues to grow in diversity and APIs and Latinxs comprise a growing majority of the population, greater inclusion in local government is critical to responsive and democratic governance. Continuing to cultivate the region’s Black leadership at the city and county levels will also be essential to realizing a more just region – including as a strategy to counter the trend of Black displacement.

Improving on this measure will require addressing the multitude of barriers that prevent more people of color from running for office. With so few people of color in elected positions, young people of color have little legacy of electoral leadership, or elders teaching them why it matters and how to do it. For some immigrants who came to this country after living in military dictatorships and other oppressive government regimes, there is trauma associated with elections and rampant corruption. Language access continues to present a barrier, and many immigrant families are focusing intensively on work and education, leaving little time for political involvement. Working class people in the region are already stretched to make rent, find affordable childcare, and secure living-wage jobs.

Myriad institutional barriers hinder people of color from getting involved in government elections. Over the last few years, wealthy donors have invested hundreds of thousands of dollars into local races, making it very difficult for someone without private wealth to successfully run a campaign. Lack of adequate translation or interpretation for non-English speakers makes it difficult to fully comprehend what is on the ballot or what is being proposed. Black and Brown people have been the target of the criminal justice system, with over policing and high rates of incarceration, which also pushes their communities away from political engagement. The displacement crisis in the region also deters involvement: people who are housing insecure or who are new to an area are not inclined to run for office. Lack of access to childcare makes it harder for mothers to find time to run. Childcare as a campaign expense is a new concept and was just recently approved as an allowable expense. In addition, lifelong politicians and political parties serve as gatekeepers and often choose their successors rather than supporting grassroots leaders connected to community organizations.

Bay Area funders and policymakers must address these barriers and advance policy changes and programs that result in more candidates from underrepresented communities getting elected to city and county elected offices, especially in communities where people of color are severely underrepresented. The Bay Area Equity Atlas and Bay Rising offer the following recommendations:

  • Local city and county governments should pass structural reforms including public campaign financing and campaign finance reform to curtail corporate contributions, secret Super PACs, and “pay-to-play” politics — and should consider shifting from at-large to district-based elections. There has been some adoption of these strategies in the region: San Francisco, Richmond, and Berkeley have public campaign financing, and Oakland has some limited public funding available, but more localities need to adopt public financing and make reforms to ensure that the resources these programs offer are enough to make a difference. San Jose is considering a 2020 ballot measure to increase disclosures of large campaign donations and limit contributions from people and companies with land-use decisions before the city, and San Francisco passed such a measure in 2019. Additionally, more than a half-dozen Bay Area cities have recently moved to district-based elections. This shift may support the election of people from underrepresented backgrounds, as the case of Fremont shows, but more time is needed to determine their effectiveness.
     
  • Local and national philanthropies and corporations should fund equity-oriented leadership development programs that prepare people from underrepresented communities of color to effectively engage in public policy. Urban Habitat’s Boards and Commissions Leadership Institute — which has been replicated in several cities — and Bay Rising’s leadership trainings exemplify the type of programs that funders should support.
     
  • Funders, political leaders, and donors should invest in training and support systems for candidates from underrepresented communities to run electoral campaigns as well as community-based programs that support new elected officials from underrepresented communities once they are in office. People active in conventional political parties should work in partnership with community organizations to recruit, train, and support candidates from underrepresented communities to run successfully at all levels of government.
     
  • Policymakers and funders should support voting reforms and civic engagement efforts that increase voter registration and turnout among underrepresented communities, especially in local elections. Reforms, including efforts to increase language access, allow noncitizens to vote in local elections, and lower the voting age to 16, are gaining attention in the Bay Area. San Francisco now allows non-citizen parents to vote in school board elections, and in November 2020, voters in the city will also have the chance to decide whether to lower the voting age to 16 for local elections. What’s more, San Jose is considering a move to align their mayoral elections to presidential election years to increase turnout, especially among underrepresented communities.


* Kimi Lee, director of Bay Rising, serves on the Equity Campaign Leaders Advisory Committee of the Bay Area Equity Atlas. Bay Rising is the only regional civic engagement organization that organizes with working-class people and people of color as voters in the Bay Area year-round. Bay Rising is the umbrella network for San Francisco Rising, Oakland Rising, and Silicon Valley Rising, and represents over thirty grassroots organizations in the Bay Area.

1 We use “city” interchangeably with “municipality” for brevity. In this analysis, “city” also includes towns. Using the May 2018 list of elected officials provided by GovBuddy, we identified the race and gender of the elected officials via web-based research. We then sent the information to the elected officials via email and mail, providing them with multiple opportunities to correct the data. We updated this list using aJuly 2019 GovBuddy list and elected officials after the November 2019 elections were identified based on the last month and year of the elected position’s term. This methodology enables the collection of broad racial/ethnic and gender categories, but not detailed ones (e.g. specific Asian or Pacific Islander subgroups, non-binary gender identification). To assess representativeness, we calculate the difference between the share of that group among top elected officials and the share of that group in the total population. For example, if 60 percent of a city’s population is Latinx but only 20 percent of electeds are Latinx, the Latinx population is underrepresented by 40 percentage points (20 percent minus 60 percent = -40 percentage points). Note that in this analysis we focus on notable shifts for city-elected positions, while on the Atlas the data for cities includes both city council and county elected officials (supervisors and DAs) because county elected officials also represent the residents of the municipalities in those respective counties. See our full methodology here

October 2019

Regional Economies in Transition

Overview

Regional economies play an important role in shaping opportunities and outcomes for low-income residents and people of color. Broad trends in the U.S. economy—such as the decline of traditional manufacturing, the growth of high-tech industries, and the rapid expansion of low-wage service jobs—occur unevenly across the nation’s largest metro areas. To better understand the implications of these trends for advancing regional equity and shared prosperity, this report presents a typology that classifies the 150 largest U.S. regions based on (1) the growth of advanced industries; (2) the decline of manufacturing jobs; and (3) the quality of service-sector jobs that generally do not require a BA degree. Understanding the connections between these factors can help local leaders identify and develop tailored strategies to grow good jobs, create accessible career pathways for people of color, nurture equitable entrepreneurial ecosystems, and improve job quality for all workers. Download the reportmethodology, and summary.

To illustrate how these interrelated dynamics manifest at the local level, the report is accompanied by three case studies of diverse metropolitan areas representing different regional types: Charlotte, North Carolina metroPhiladelphia, Pennsylvania metro; and Stockton, California metro.

Pages